

Energy Metabolites and Indicative Significance of α-Ketoglutarate and α-Ketoglutaramate in Assessing the Progression of Chronic Hepatoencephalopathy
- PMID: 38397454
- PMCID: PMC10887089
- DOI: 10.3390/biom14020217
Energy Metabolites and Indicative Significance of α-Ketoglutarate and α-Ketoglutaramate in Assessing the Progression of Chronic Hepatoencephalopathy
Abstract
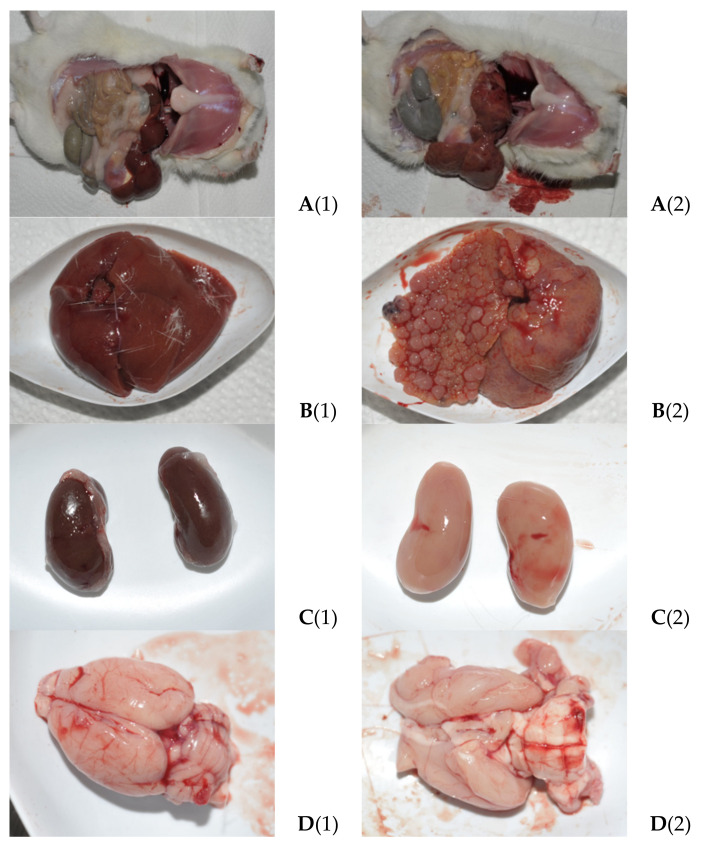
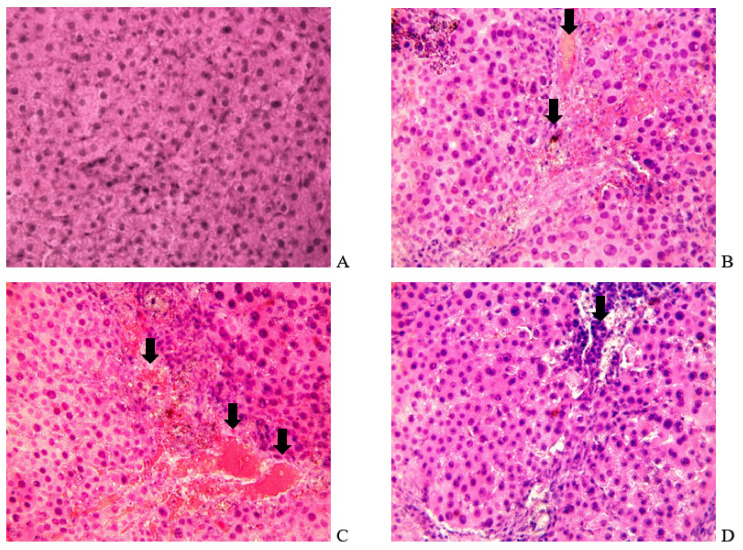
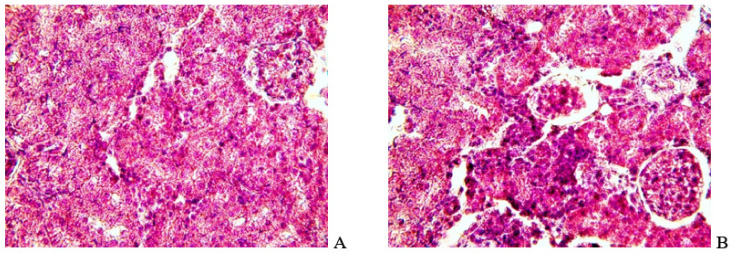
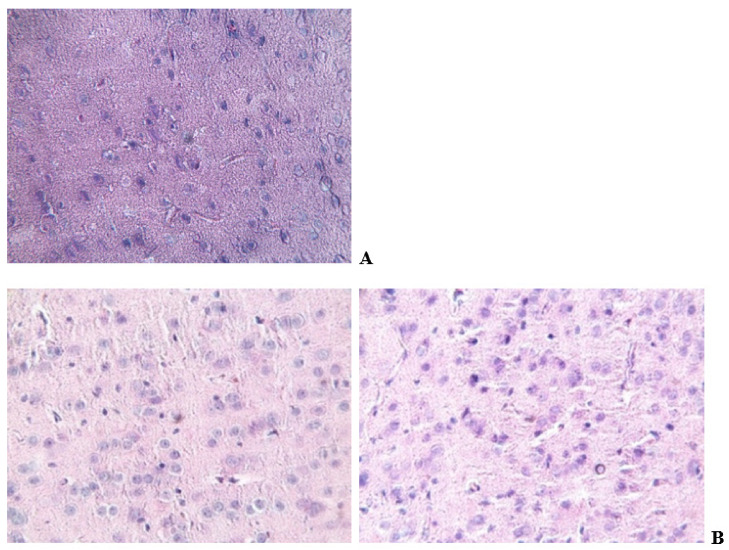
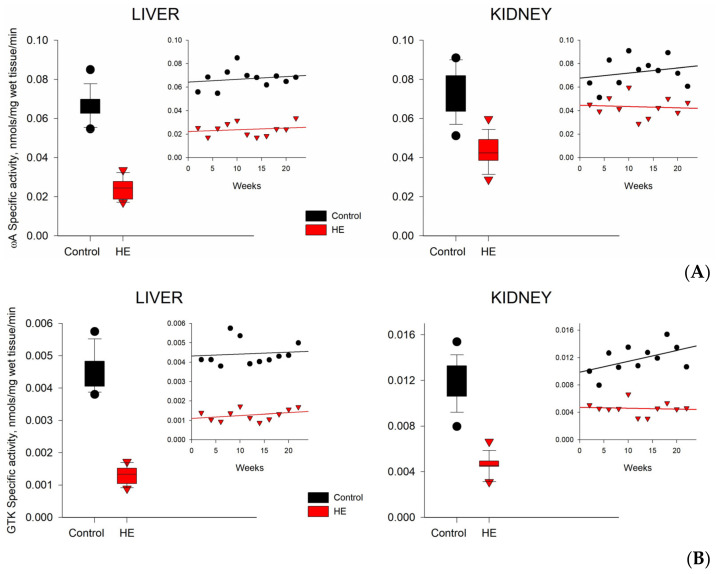
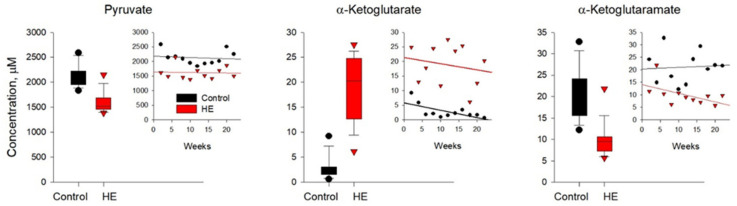
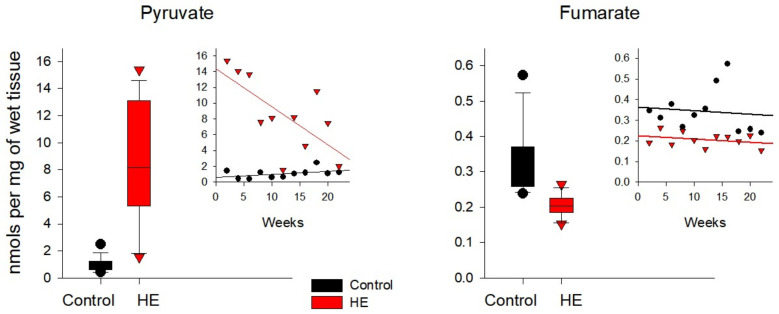
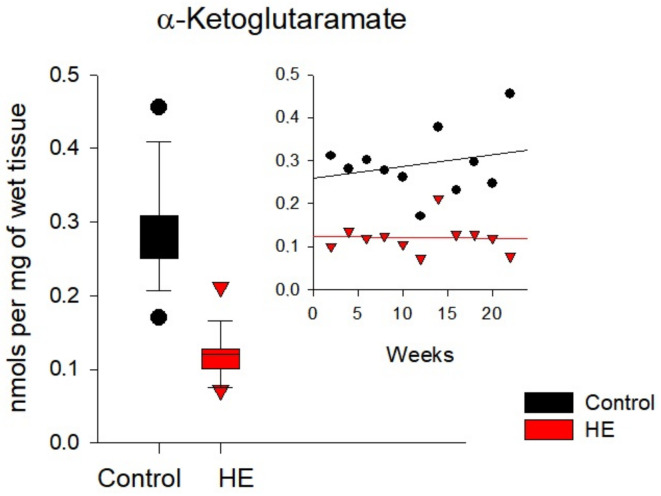
In the example of a rat model with chronic hepatoencephalopathy (HE), changes in the organ morphology of rats affect the balance of metabolites of the tricarboxylic acid (TCA) cycle and metabolites of the glutamine-glutamate (Gln-Glu) cycle, namely α-ketoglutarate (αKG) and α-ketoglutaramate (αKGM), as well as the enzymes associated with them, ω-amidase (ωA) and glutamine transaminase (GTK). This model of rats was obtained as a result of 2-22 weeks of consumption by animals of hepatotoxin thioacetamide (TAA) added to drinking water at a concentration of 0.4 g/L. The control (n = 26) and TAA-induced (n = 55) groups of rats consisted of 11 cohorts each. The control cohorts consisted of 2-4 rats, and the TAA-induced cohorts consisted of 4-7 individuals. Every two weeks, samples of blood plasma, liver, kidney, and brain tissues were taken from the next cohort of rats (a total of 320 samples). By the end of the experiment, irreversible morphological changes were observed in the organs of rats: the weight of the animals was reduced up to ~45%, the weight of the kidneys up to 5%, the brain up to ~20%, and the weight of the liver increased up to ~20%. The analysis revealed: (i) a decrease in the activity of ωA and GTK in the tissues of the brain, kidneys, and liver of rats with chronic HE (by ~3, 40, and 65% and ~10, 60, and 70%, respectively); and (ii) the appearance of a significant imbalance in the content of metabolites of the Gln-Glu cycle, αKG, and αKGM. It is indicative that a ~1.5-12-fold increase in the level of αKG in the blood plasma and tissues of the organs of rats with chronic HE was accompanied by a synchronous, ~1.2-2.5-fold decrease in the level of αKGM. The data obtained indicate an essential involvement of the Gln-Glu cycle in the regulation of energy metabolism in rats under conditions of chronic HE. Attention is focused on the significance of the αKG/αKGM ratio, which can act as a potential marker for diagnosing the degree of HE development.
Keywords: HPLC; glutamine transaminase; hepatoencephalopathy; thioacetamide; tricarboxylic acid cycle; α-ketoglutaramate; α-ketoglutarate; ω-amidase.
Conflict of interest statement
The authors declare no conflicts of interest.
Figures
Similar articles
-
The Balance of Ketoacids α-Ketoglutarate and α-Ketoglutaramate Reflects the Degree of the Development of Hepatoencephalopathy in Rats.Int J Mol Sci. 2024 Dec 18;25(24):13568. doi: 10.3390/ijms252413568. Int J Mol Sci. 2024. PMID: 39769330 Free PMC article. Review.
-
High Levels of Glutaminase II Pathway Enzymes in Normal and Cancerous Prostate Suggest a Role in 'Glutamine Addiction'.Biomolecules. 2019 Dec 18;10(1):2. doi: 10.3390/biom10010002. Biomolecules. 2019. PMID: 31861280 Free PMC article.
-
The metabolic importance of the glutaminase II pathway in normal and cancerous cells.Anal Biochem. 2022 May 1;644:114083. doi: 10.1016/j.ab.2020.114083. Epub 2020 Dec 23. Anal Biochem. 2022. PMID: 33352190 Review.
-
The role of glutamine transaminase K (GTK) in sulfur and alpha-keto acid metabolism in the brain, and in the possible bioactivation of neurotoxicants.Neurochem Int. 2004 Jun;44(8):557-77. doi: 10.1016/j.neuint.2003.12.002. Neurochem Int. 2004. PMID: 15016471 Review.
-
Tricarboxylic Acid Metabolite Imbalance in Rats with Acute Thioacetamide-Induced Hepatic Encephalopathy Indicates Incomplete Recovery.Int J Mol Sci. 2023 Jan 10;24(2):1384. doi: 10.3390/ijms24021384. Int J Mol Sci. 2023. PMID: 36674898 Free PMC article.
Cited by
-
The Balance of Ketoacids α-Ketoglutarate and α-Ketoglutaramate Reflects the Degree of the Development of Hepatoencephalopathy in Rats.Int J Mol Sci. 2024 Dec 18;25(24):13568. doi: 10.3390/ijms252413568. Int J Mol Sci. 2024. PMID: 39769330 Free PMC article. Review.
-
Bioenergetic biomarkers as predictive indicators and their relationship with cognitive function in newly diagnosed, drug-naïve patients with bipolar disorder.Transl Psychiatry. 2025 Apr 14;15(1):148. doi: 10.1038/s41398-025-03367-7. Transl Psychiatry. 2025. PMID: 40229236 Free PMC article.
-
Preparative Coupled Enzymatic Synthesis of L-Homophenylalanine and 2-Hydroxy-5-oxoproline with Direct In Situ Product Crystallization and Cyclization.ACS Omega. 2025 Apr 2;10(14):14382-14389. doi: 10.1021/acsomega.5c00590. eCollection 2025 Apr 15. ACS Omega. 2025. PMID: 40256536 Free PMC article.
References
MeSH terms
Substances
LinkOut - more resources
Full Text Sources
