

Screening of Active Substances Regulating Alzheimer's Disease in Ginger and Visualization of the Effectiveness on 6-Gingerol Pathway Targets
- PMID: 38397589
- PMCID: PMC10888025
- DOI: 10.3390/foods13040612
Screening of Active Substances Regulating Alzheimer's Disease in Ginger and Visualization of the Effectiveness on 6-Gingerol Pathway Targets
Abstract
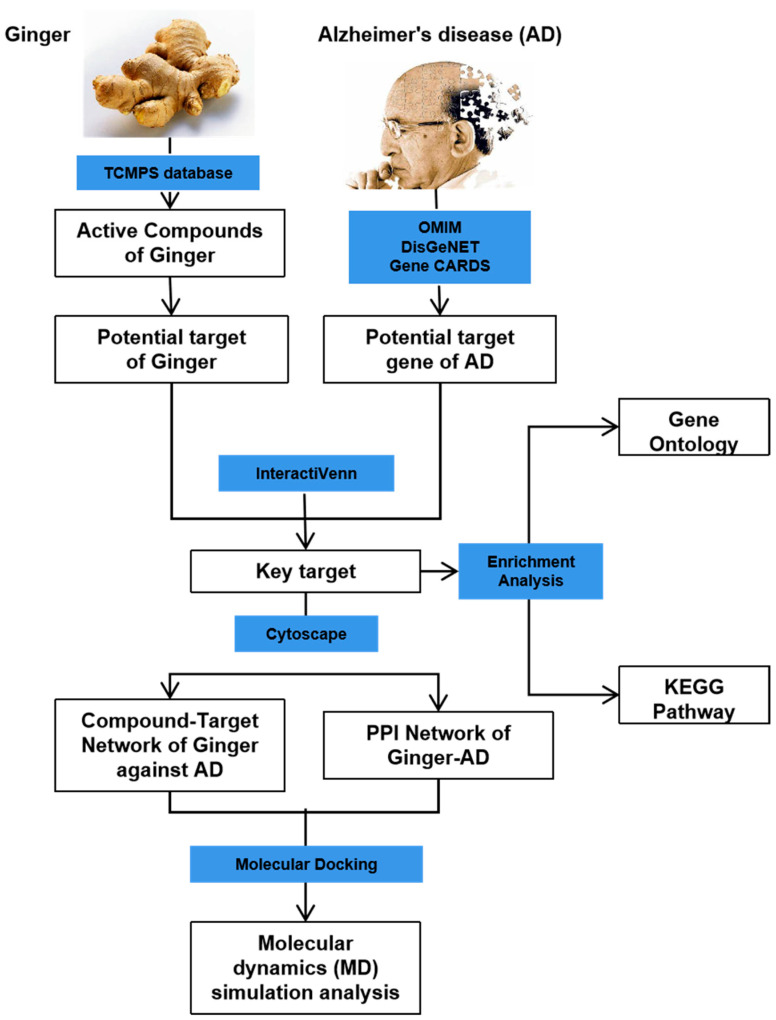
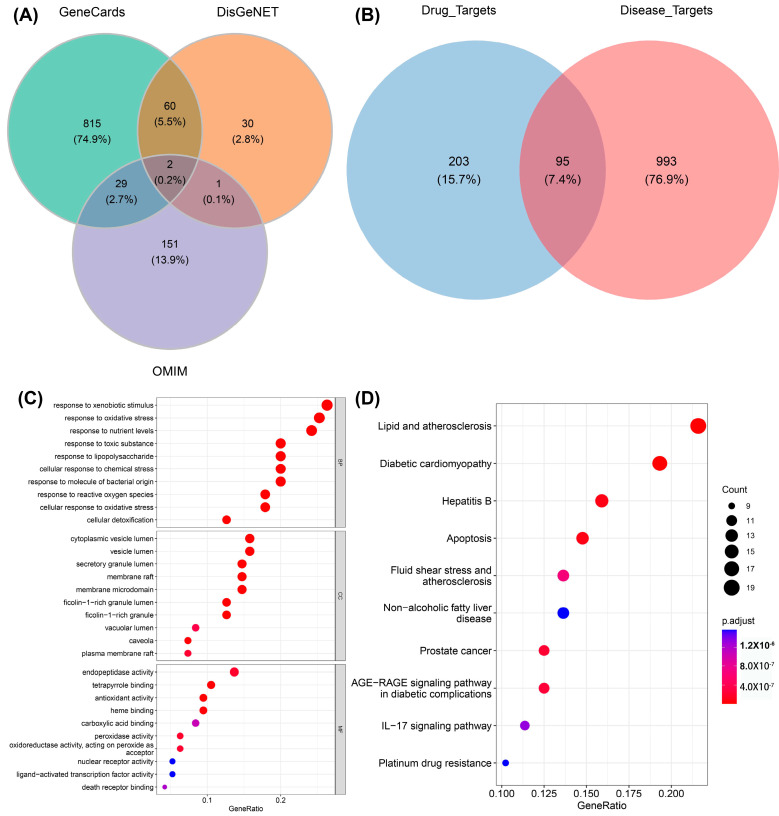
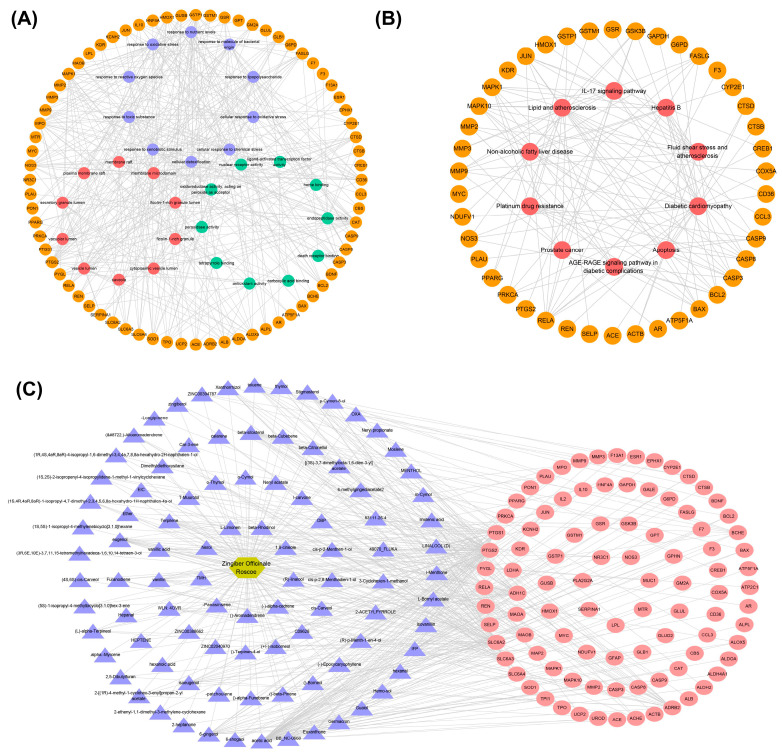
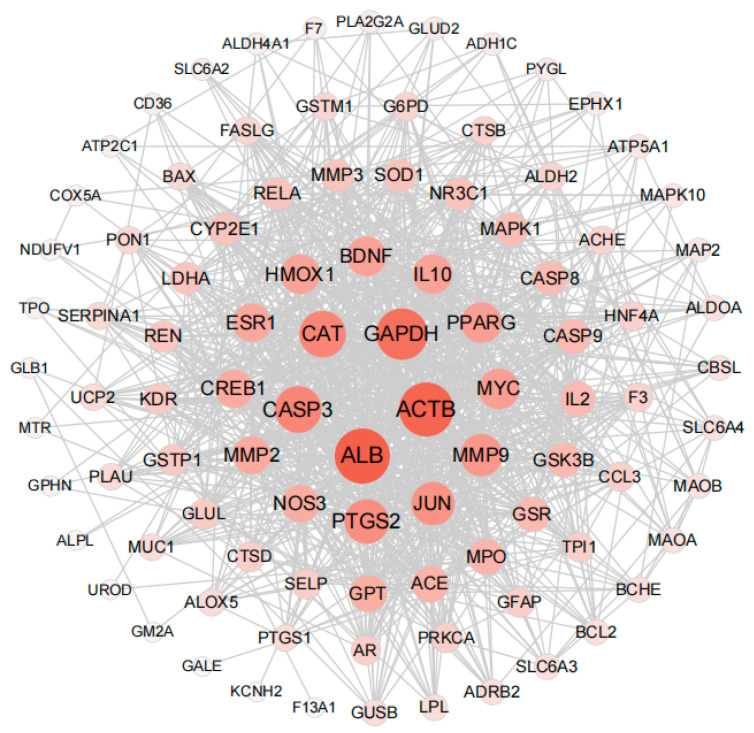
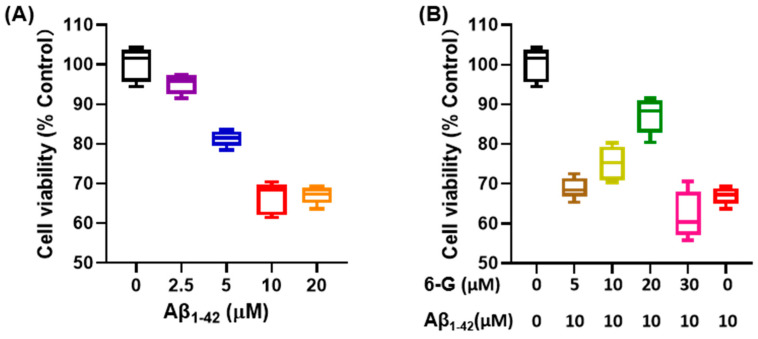
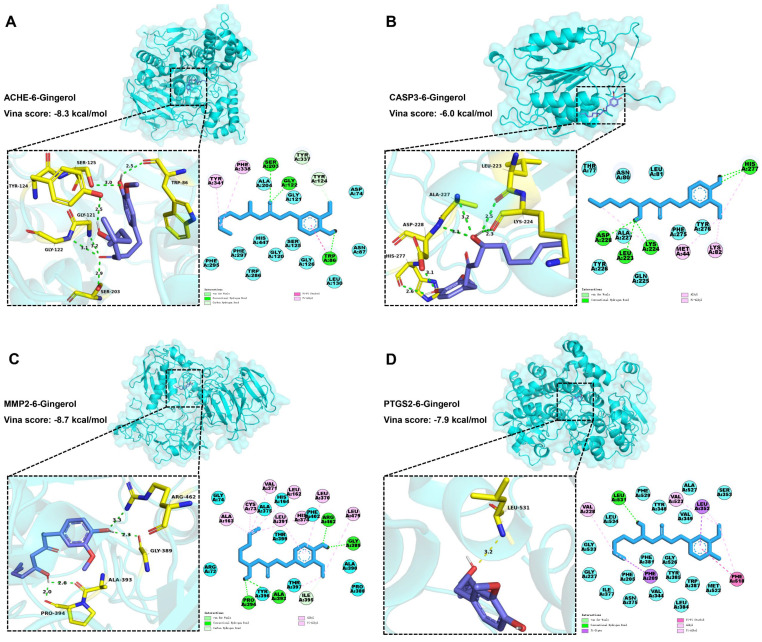
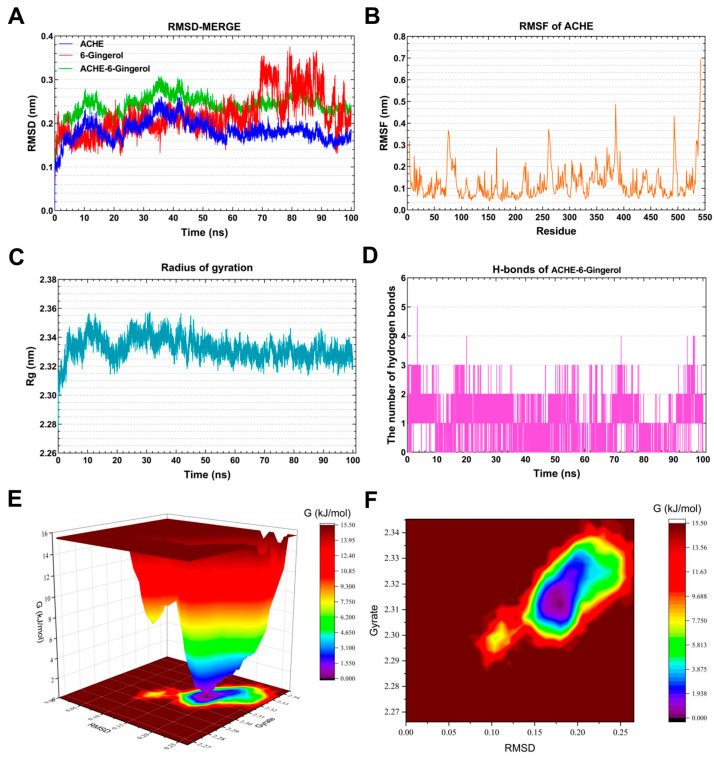
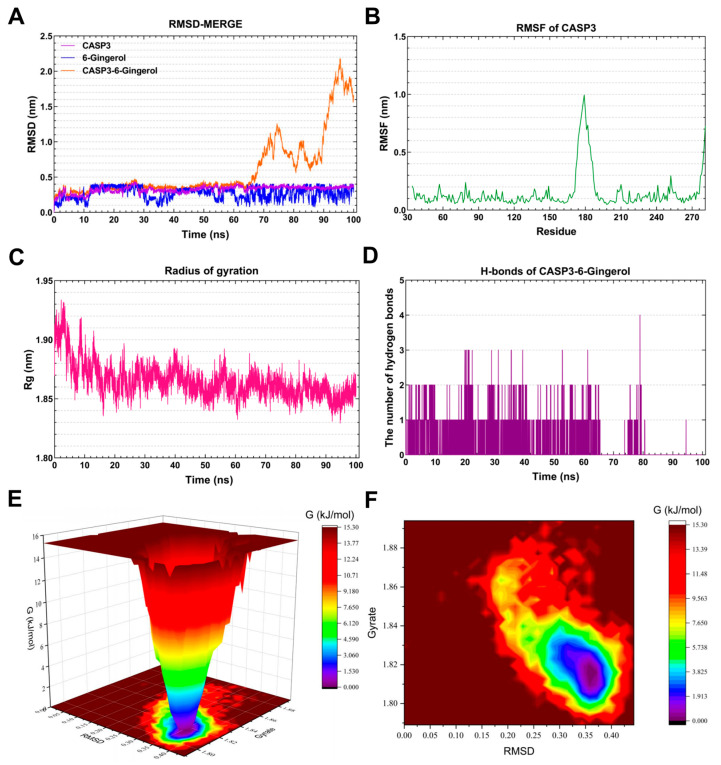
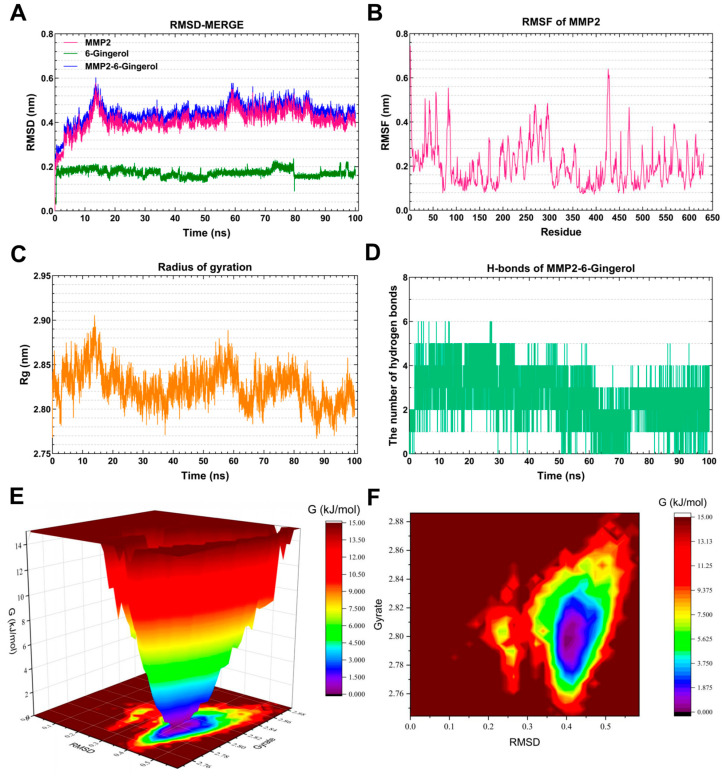
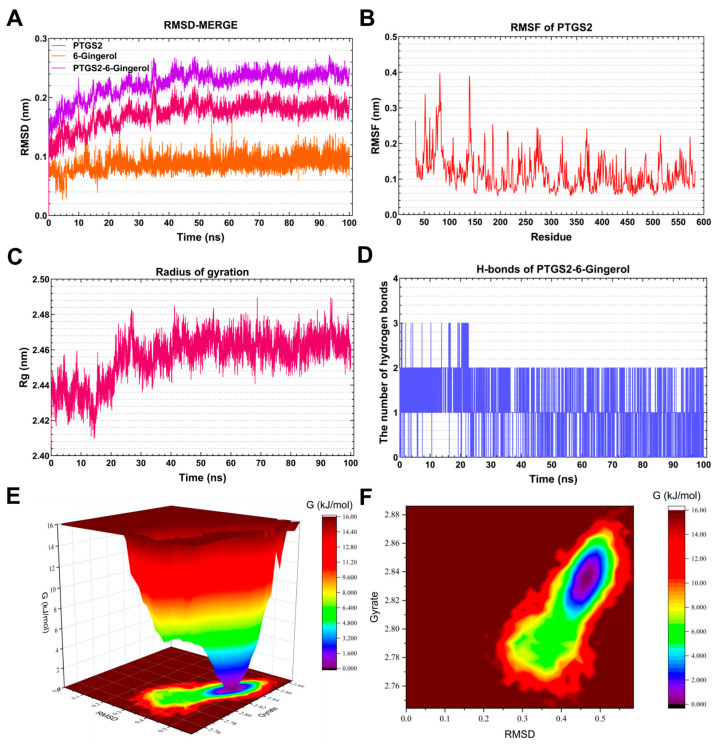
Ginger has been reported to potentially treat Alzheimer's disease (AD), but the specific compounds responsible for this biological function and their mechanisms are still unknown. In this study, a combination of network pharmacology, molecular docking, and dynamic simulation technology was used to screen active substances that regulate AD and explore their mechanisms. The TCMSP, GeneCards, OMIM, and DisGeNET databases were utilized to obtain 95 cross-targets related to ginger's active ingredients and AD as key targets. A functional enrichment analysis revealed that the pathways in which ginger's active substances may be involved in regulating AD include response to exogenous stimuli, response to oxidative stress, response to toxic substances, and lipid metabolism, among others. Furthermore, a drug-active ingredient-key target interaction network diagram was constructed, highlighting that 6-Gingerol is associated with 16 key targets. Additionally, a protein-protein interaction (PPI) network was mapped for the key targets, and HUB genes (ALB, ACTB, GAPDH, CASP3, and CAT) were identified. Based on the results of network pharmacology and cell experiments, 6-Gingerol was selected as the active ingredient for further investigation. Molecular docking was performed between 6-Gingerol and its 16 key targets, and the top three proteins with the strongest binding affinities (ACHE, MMP2, and PTGS2) were chosen for molecular dynamics analysis together with the CASP3 protein as the HUB gene. The findings indicate that 6-Gingerol exhibits strong binding ability to these disease targets, suggesting its potential role in regulating AD at the molecular level, as well as in abnormal cholinesterase metabolism and cell apoptosis, among other related regulatory pathways. These results provide a solid theoretical foundation for future in vitro experiments using actual cells and animal experiments to further investigate the application of 6-Gingerol.
Keywords: 6-Gingerol; Alzheimer’s disease (AD); ginger; molecular dynamics (MD); network pharmacology.
Conflict of interest statement
The authors declare no conflict of interest.
Figures
Similar articles
-
Exploring active ingredients and mechanisms of Coptidis Rhizoma-ginger against colon cancer using network pharmacology and molecular docking.Technol Health Care. 2024;32(S1):523-542. doi: 10.3233/THC-248046. Technol Health Care. 2024. PMID: 38759074 Free PMC article.
-
Integration of Network Pharmacology and Molecular Docking Technology Reveals the Mechanism of the Therapeutic Effect of Xixin Decoction on Alzheimer's Disease.Comb Chem High Throughput Screen. 2022;25(10):1785-1804. doi: 10.2174/1386207325666220523151119. Comb Chem High Throughput Screen. 2022. PMID: 35616676
-
Molecular Targets and Mechanisms of Scutellariae radix-Coptidis rhizoma Drug Pair for the Treatment of Ulcerative Colitis Based on Network Pharmacology and Molecular Docking.Evid Based Complement Alternat Med. 2021 Jun 4;2021:9929093. doi: 10.1155/2021/9929093. eCollection 2021. Evid Based Complement Alternat Med. 2021. PMID: 34149863 Free PMC article.
-
Apigenin inhibits proliferation and differentiation of cardiac fibroblasts through AKT/GSK3β signaling pathway.J Ethnopharmacol. 2024 Nov 15;334:118518. doi: 10.1016/j.jep.2024.118518. Epub 2024 Jul 2. J Ethnopharmacol. 2024. PMID: 38964628
-
[Exploring the mechanisms of Jujing pill on varicocele-associated male infertility via network pharmacology and molecular docking technology].Zhonghua Nan Ke Xue. 2023 Aug;29(8):688-697. Zhonghua Nan Ke Xue. 2023. PMID: 38619514 Chinese.
Cited by
-
Integrating bioinformatics and ferroptosis to reveal the protective mechanism of Astragaloside IV on chronic heart failure rats.Sci Rep. 2024 Sep 6;14(1):20787. doi: 10.1038/s41598-024-72011-z. Sci Rep. 2024. PMID: 39242661 Free PMC article.
-
Mechanisms of QiShenYiQi in Inhibiting Blood-Brain Barrier Damage Following Stroke: A Network Pharmacology and Experimental Study.Comb Chem High Throughput Screen. 2025;28(10):1694-1710. doi: 10.2174/0113862073295270240522104058. Comb Chem High Throughput Screen. 2025. PMID: 38847173
References
-
- Hampel H., Hardy J., Blennow K., Chen C., Perry G., Kim S.H., Villemagne V.L., Aisen P., Vendruscolo M., Iwatsubo T., et al. ; Chen, C.; Perry, G.; Kim, S.H.; Villemagne, V.L.; Aisen, P.; Vendruscolo, M.; Iwatsubo, T.; et al. The Amyloid-β Pathway in Alzheimer’s Disease. Mol. Psychiatry. 2021;26:5481–5503. doi: 10.1038/s41380-021-01249-0. - DOI - PMC - PubMed
Grants and funding
LinkOut - more resources
Full Text Sources
Research Materials
Miscellaneous
