

Neuroprotection Afforded by an Enriched Mediterranean-like Diet Is Modified by Exercise in a Rat Male Model of Cerebral Ischemia
- PMID: 38397735
- PMCID: PMC10885962
- DOI: 10.3390/antiox13020138
Neuroprotection Afforded by an Enriched Mediterranean-like Diet Is Modified by Exercise in a Rat Male Model of Cerebral Ischemia
Abstract
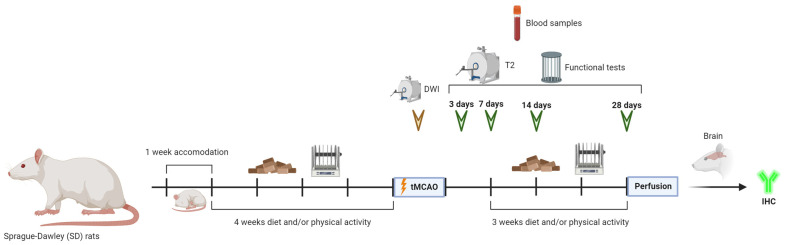
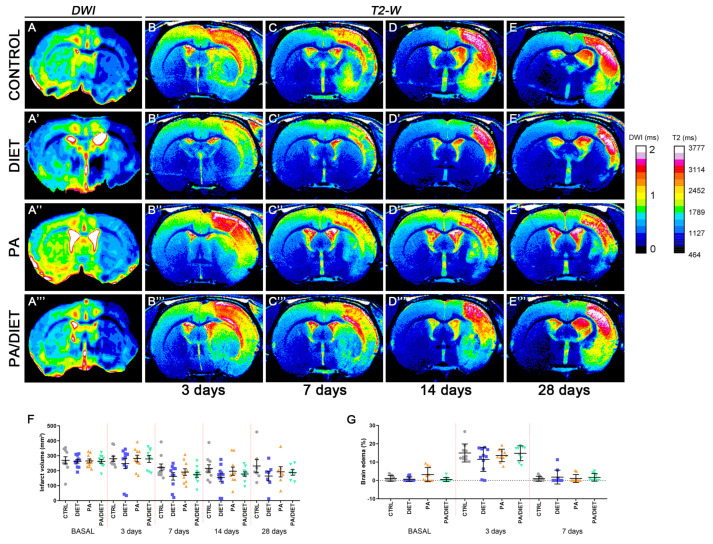
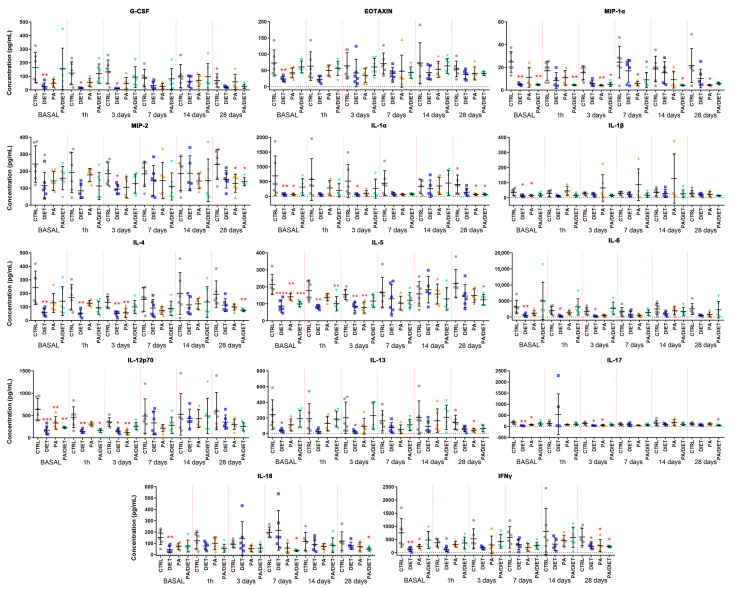
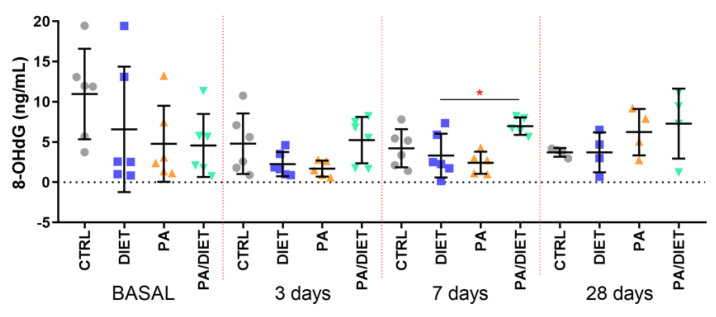
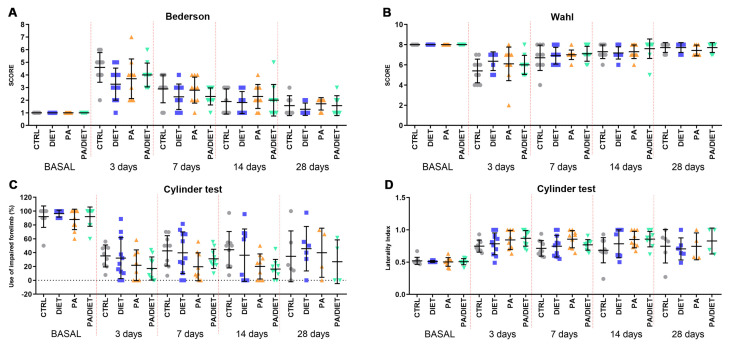
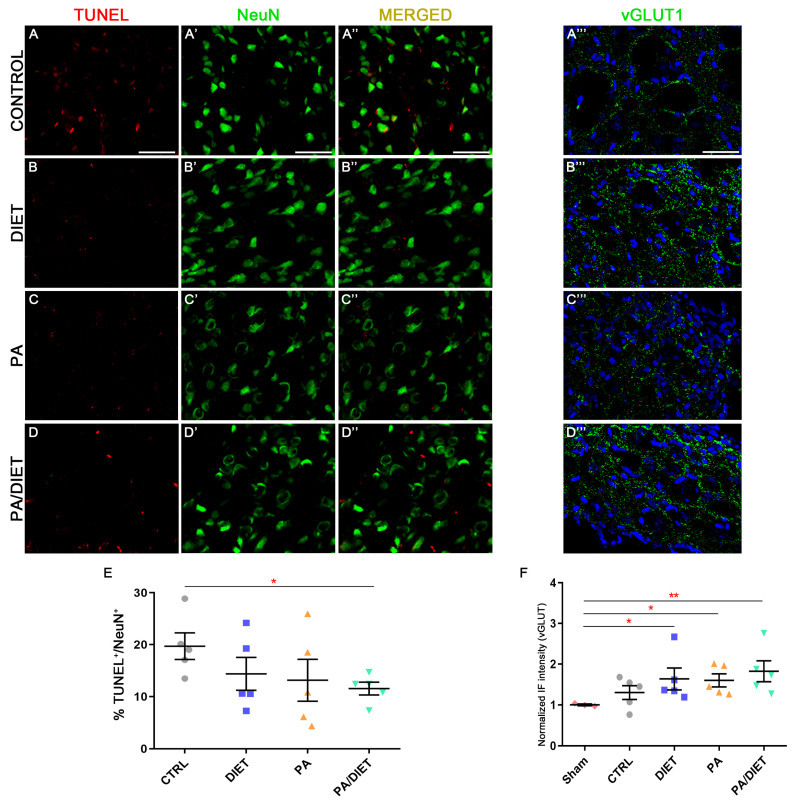
Ischemic stroke is an important cause of mortality and disability worldwide. Given that current treatments do not allow a remarkably better outcome in patients after stroke, it is mandatory to seek new approaches to preventing stroke and/or complementing the current treatments or ameliorating the ischemic insult. Multiple preclinical and clinical studies highlighted the potential beneficial roles of exercise and a Mediterranean diet following a stroke. Here, we investigated the effects of a pre-stroke Mediterranean-like diet supplemented with hydroxytyrosol and with/without physical exercise on male rats undergoing transient middle cerebral artery occlusion (tMCAO). We also assessed a potential synergistic effect with physical exercise. Our findings indicated that the diet reduced infarct and edema volumes, modulated acute immune response by altering cytokine and chemokine levels, decreased oxidative stress, and improved acute functional recovery post-ischemic injury. Interestingly, while physical exercise alone improved certain outcomes compared to control animals, it did not enhance, and in some aspects even impaired, the positive effects of the Mediterranean-like diet in the short term. Overall, these data provide the first preclinical evidence that a preemptive enriched Mediterranean diet modulates cytokines/chemokines levels downwards which eventually has an important role during the acute phase following ischemic damage, likely mediating neuroprotection.
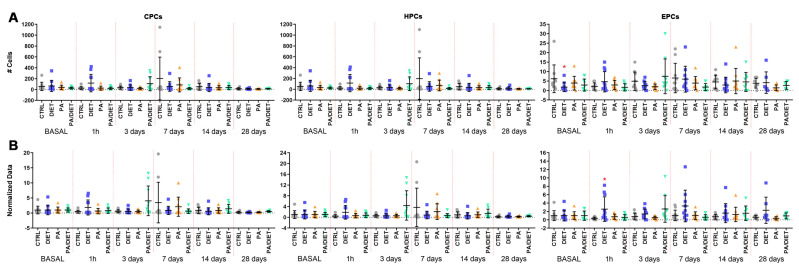
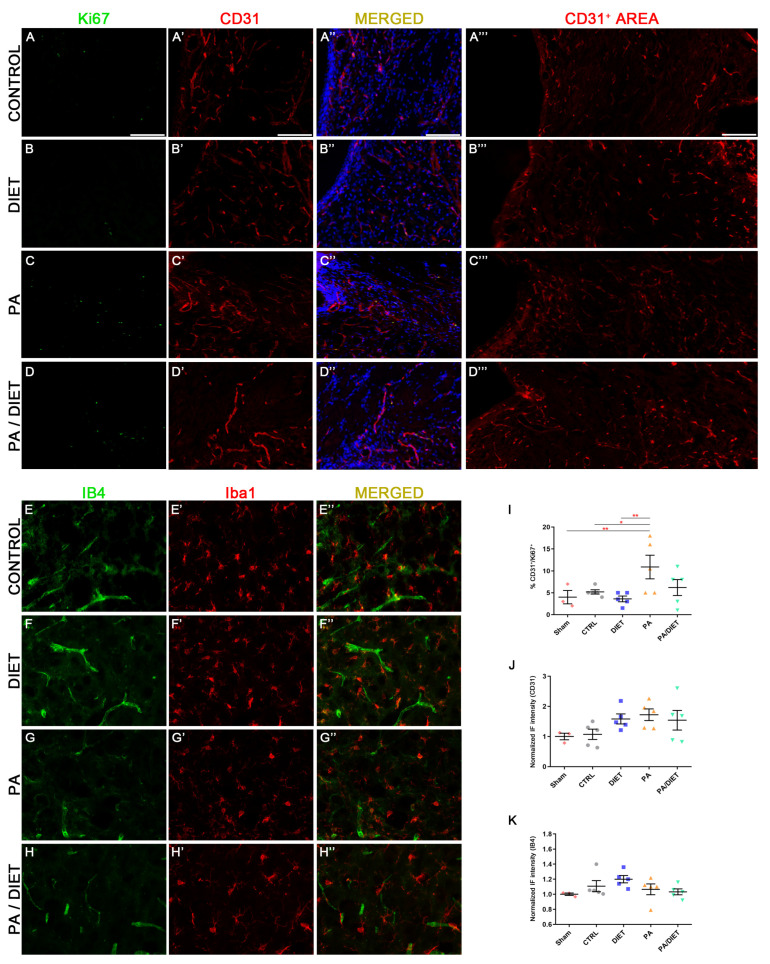
Keywords: EPCs; Milliplex; cerebral ischemia; exercise; hydroxytyrosol; inflammation; mediterranean diet; microglia; neuroprotection; tMCAO.
Conflict of interest statement
The authors declare no conflicts of interest.
Figures
Similar articles
-
Impact of hydroxytyrosol on stroke: tracking therapy response on neuroinflammation and cerebrovascular parameters using PET-MR imaging and on functional outcomes.Theranostics. 2021 Feb 15;11(9):4030-4049. doi: 10.7150/thno.48110. eCollection 2021. Theranostics. 2021. PMID: 33754046 Free PMC article.
-
Neuroprotection by progesterone after transient cerebral ischemia in stroke-prone spontaneously hypertensive rats.Horm Behav. 2016 Aug;84:29-40. doi: 10.1016/j.yhbeh.2016.06.002. Epub 2016 Jun 6. Horm Behav. 2016. PMID: 27283379
-
Bioinformatic Analysis of Exosomal MicroRNAs of Cerebrospinal Fluid in Ischemic Stroke Rats After Physical Exercise.Neurochem Res. 2021 Jun;46(6):1540-1553. doi: 10.1007/s11064-021-03294-1. Epub 2021 Mar 11. Neurochem Res. 2021. PMID: 33709257
-
Brain cooling during transient focal ischemia provides complete neuroprotection.Neurosci Biobehav Rev. 1997 Jan;21(1):31-44. doi: 10.1016/0149-7634(95)00080-1. Neurosci Biobehav Rev. 1997. PMID: 8994207 Review.
-
Neuroprotective profile of enoxaparin, a low molecular weight heparin, in in vivo models of cerebral ischemia or traumatic brain injury in rats: a review.CNS Drug Rev. 2002 Spring;8(1):1-30. doi: 10.1111/j.1527-3458.2002.tb00213.x. CNS Drug Rev. 2002. PMID: 12070524 Free PMC article. Review.
Cited by
-
Hydroxytyrosol and Brain Tumors: Mechanisms of Action and Therapeutic Potential.Curr Issues Mol Biol. 2025 Aug 18;47(8):667. doi: 10.3390/cimb47080667. Curr Issues Mol Biol. 2025. PMID: 40864821 Free PMC article. Review.
-
Mediterranean Diet Prior to Ischemic Stroke and Potential Circulating Mediators of Favorable Outcomes.Nutrients. 2024 Sep 23;16(18):3218. doi: 10.3390/nu16183218. Nutrients. 2024. PMID: 39339817 Free PMC article.
References
Grants and funding
- IN607D 2020/09/Xunta de Galicia
- IN607A2022/07/Xunta de Galicia
- IN606A-2021/015/Xunta de Galicia
- RTI2018-102165-B-I00/Ministerio de Ciencia e Innovación
- RTC2019-007373-1/Ministerio de Ciencia e Innovación
- PDC2022-134000-I00/Ministerio de Ciencia e Innovación
- CM19/00235/Instituto de Salud Carlos III
- PI18/01096/Instituto de Salud Carlos III
- INT19/00075/Instituto de Salud Carlos III
- PI22/00938/Instituto de Salud Carlos III
- CB22/05/00067/Biomedical Research Networking Center on Neurodegenerative Diseases
- 101066444/Marie Skłodowska-Curie Actions (MSCA)
- EAPA_791/2018_ NEUROATLANTIC project/INTERREG Atlantic Area
- 0624_2IQBIONEURO_6_E/INTER-REG V A España Portugal (POCTEP)
LinkOut - more resources
Full Text Sources
