. 2024 Feb 4;13(2):196.
doi: 10.3390/antiox13020196.

IP3R-Mediated Calcium Release Promotes Ferroptotic Death in SH-SY5Y Neuroblastoma Cells

Affiliations

IP3R-Mediated Calcium Release Promotes Ferroptotic Death in SH-SY5Y Neuroblastoma Cells

Joaquín Campos et al. Antioxidants (Basel). .

Abstract

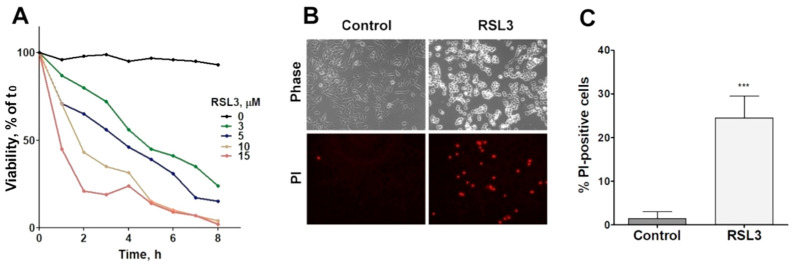
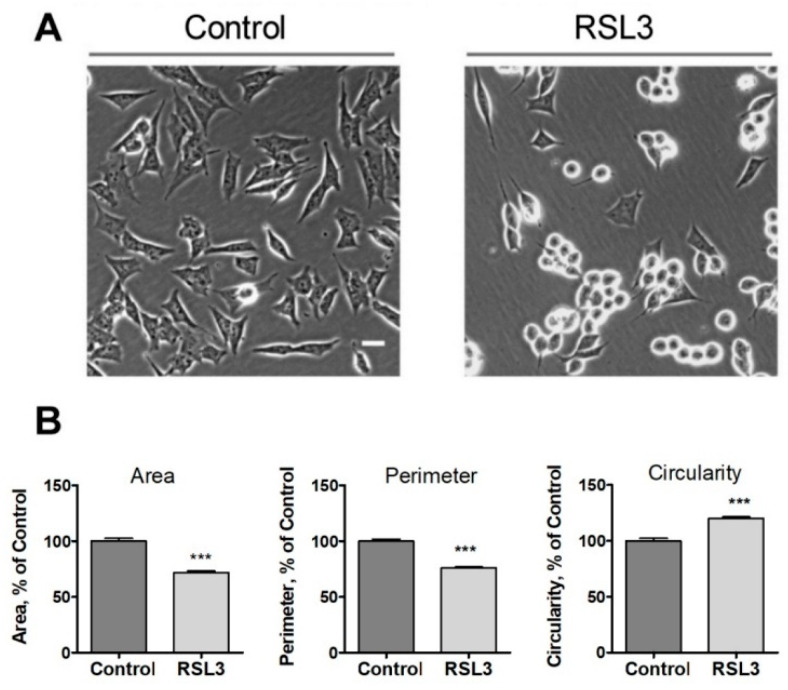
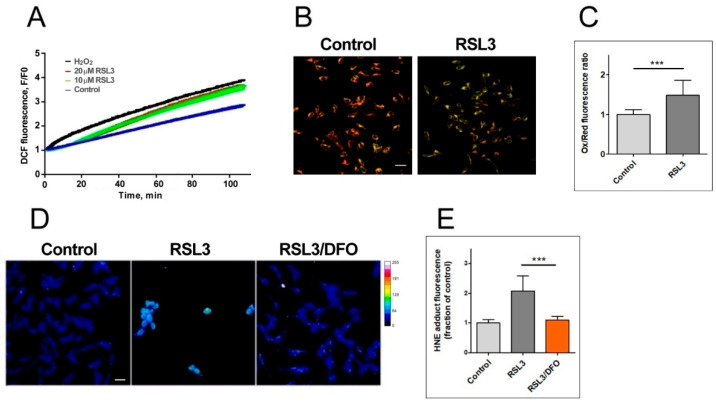
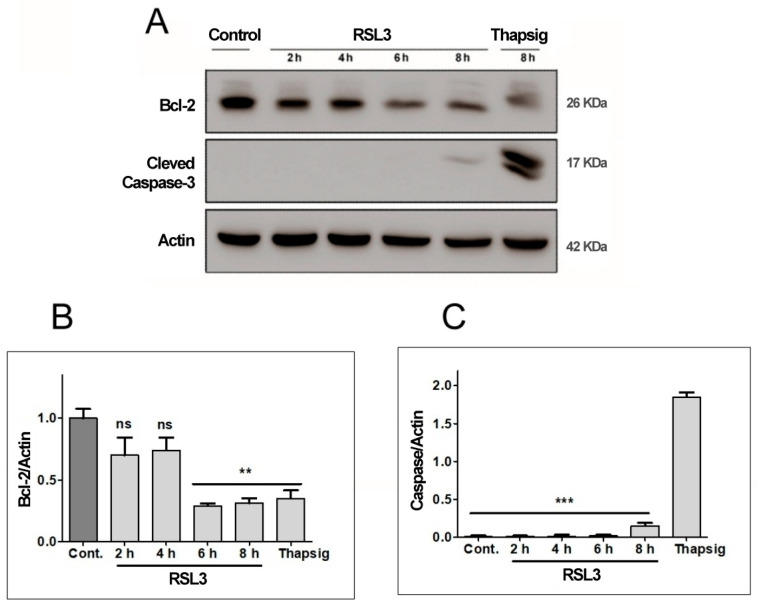
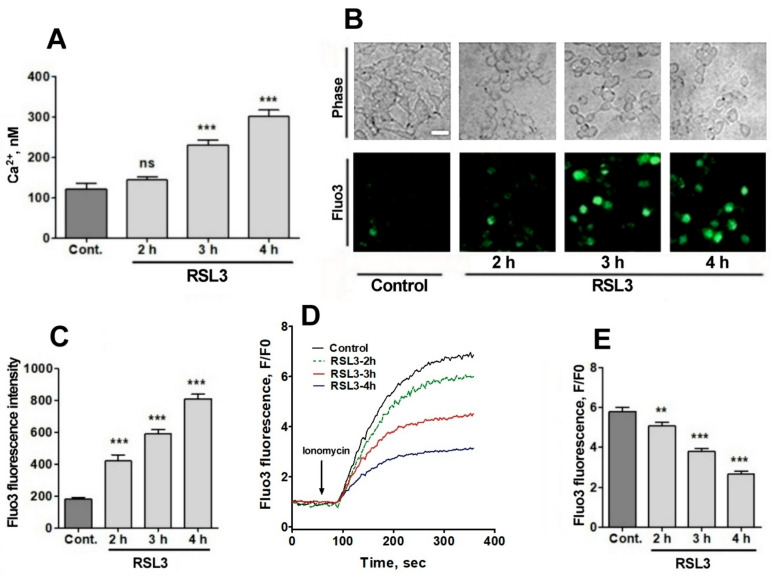
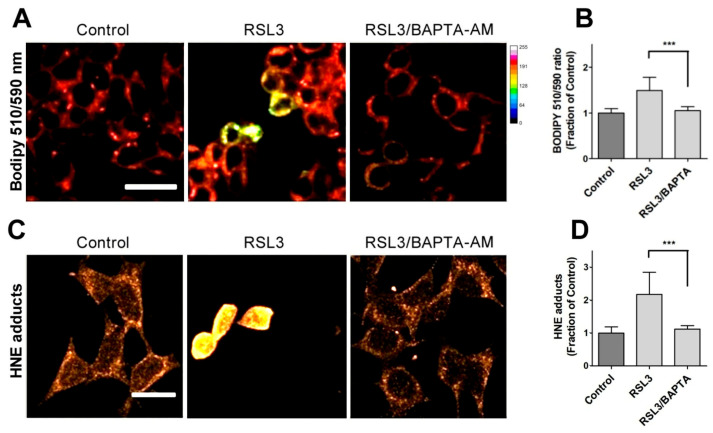
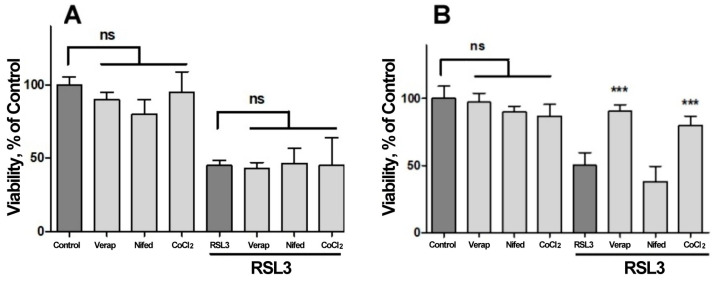
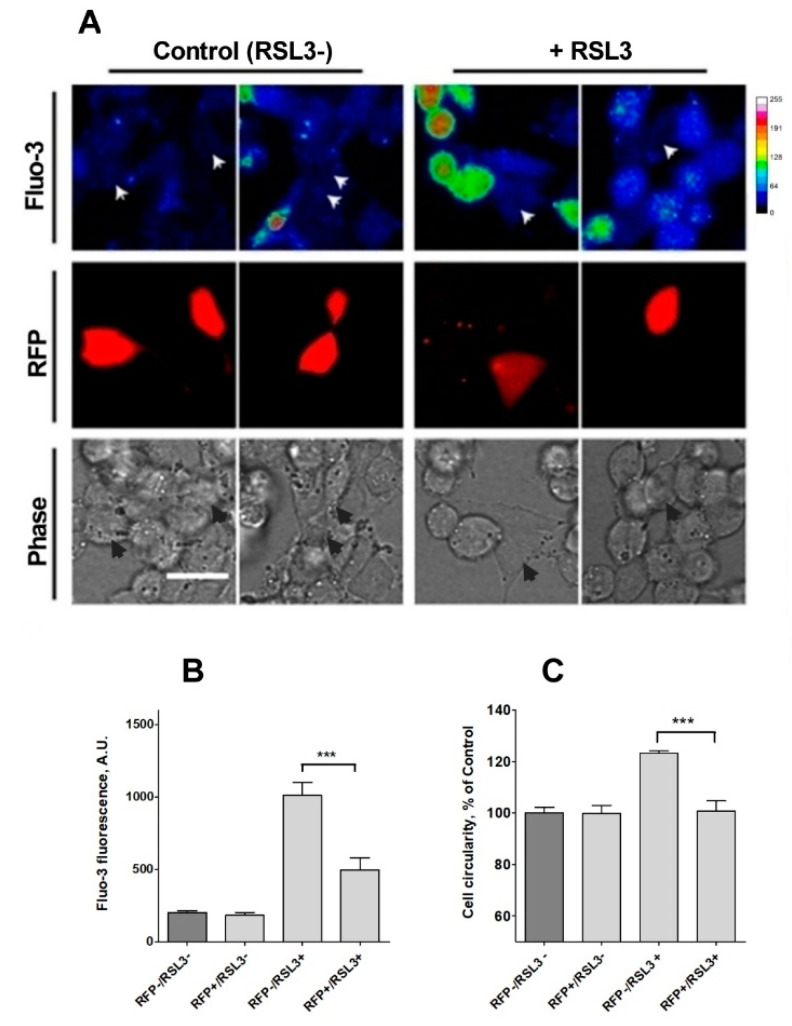
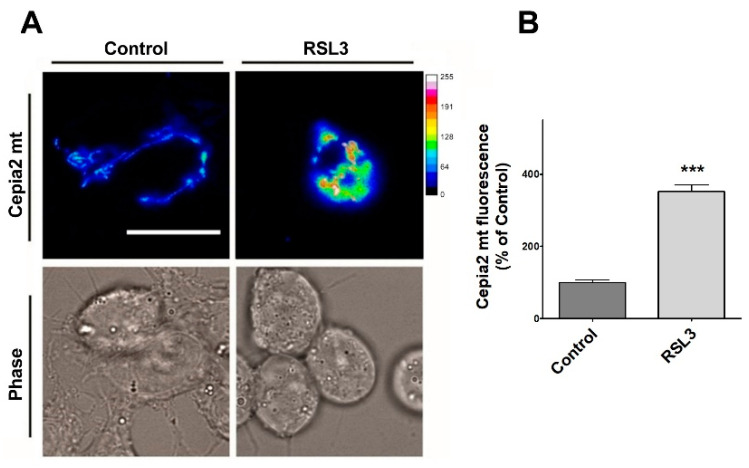
Ferroptosis is an iron-dependent cell death pathway that involves the depletion of intracellular glutathione (GSH) levels and iron-mediated lipid peroxidation. Ferroptosis is experimentally caused by the inhibition of the cystine/glutamate antiporter xCT, which depletes cells of GSH, or by inhibition of glutathione peroxidase 4 (GPx4), a key regulator of lipid peroxidation. The events that occur between GPx4 inhibition and the execution of ferroptotic cell death are currently a matter of active research. Previous work has shown that calcium release from the endoplasmic reticulum (ER) mediated by ryanodine receptor (RyR) channels contributes to ferroptosis-induced cell death in primary hippocampal neurons. Here, we used SH-SY5Y neuroblastoma cells, which do not express RyR channels, to test if calcium release mediated by the inositol 1,4,5-trisphosphate receptor (IP3R) channel plays a role in this process. We show that treatment with RAS Selective Lethal Compound 3 (RSL3), a GPx4 inhibitor, enhanced reactive oxygen species (ROS) generation, increased cytoplasmic and mitochondrial calcium levels, increased lipid peroxidation, and caused cell death. The RSL3-induced calcium signals were inhibited by Xestospongin B, a specific inhibitor of the ER-resident IP3R calcium channel, by decreasing IP3R levels with carbachol and by IP3R1 knockdown, which also prevented the changes in cell morphology toward roundness induced by RSL3. Intracellular calcium chelation by incubation with BAPTA-AM inhibited RSL3-induced calcium signals, which were not affected by extracellular calcium depletion. We propose that GPx4 inhibition activates IP3R-mediated calcium release in SH-SY5Y cells, leading to increased cytoplasmic and mitochondrial calcium levels, which, in turn, stimulate ROS production and induce lipid peroxidation and cell death in a noxious positive feedback cycle.

Keywords: RSL3; calcium signaling; cell death; endoplasmic reticulum; ferroptosis; glutathione peroxidase; lipid peroxidation; oxidative stress; reactive oxygen species.


Conflict of interest statement

The authors declare no conflicts of interest.

Figures

Figure 1
Figure 1
RSL3 affects the viability of SH-SY5Y cells. (A) Cells were treated with different concentrations of RSL3 for different times and viability was evaluated with the MTT assay. Viability at time = 0 was normalized to 100%. Values represent means of 5 replicates per experimental point of a representative experiment. N = 3 independent experiments. (B) Cells were treated for 3 h with 5 µM RSL3 or vehicle (DMSO, Control) and were stained with propidium iodine (PI, red) to evaluate dead cells in the population. Representative images are shown. Scale bar: 80 µm. (C) Quantification of PI-positive cells. Values represent the mean ± SD from 200–250 cells per experimental condition; *** p < 0.001.
Figure 2
Figure 2
Effects of RSL3 on cell morphology. Cells were treated for 3 h with 5 µM RSL3 or vehicle and then photographed using phase contrast. (A) Representative images of Control and RSL3 treatment conditions. Scale bar 20 µm. (B) Evaluation of area, perimeter, and roundness parameters. Values represent mean ± SEM. Between 62 and 123 cells were evaluated for each experimental condition; N = 3 independent experiments; *** p < 0.001.
Figure 3
Figure 3
RSL3 induces an increase in ROS production and lipid peroxidation. (A) SH-SY5Y cells were loaded with H2DCFDA and were then treated at t = 0 with 10 µM or 20 µM RSL3 or 250 µM H2O2; DCF fluorescence intensity was recorded over time. Values represent means of 5 replicates per experimental condition. N = 3 independent experiments. (B) SH-SY5Y cells, treated for 3 h with 5 µM RSL3 or vehicle, were stained with BODIPY C11. Representative images of the overlapping values collected by the red (reduced, 590 nm emission) and green (oxidized, 510 nm emission) fluorescence channels for each condition are shown. Scale bar 20 µm. (C) Quantification of the ratio of the green to red fluorescence intensity. Values represent mean ± SD of 150 cells; *** p < 0.001. (D) Cells were treated for 4 h without (control) or with 5 µM RSL3. Representative frames of HNE adducts immunofluorescence are shown. Scale bar 20 µm. The upper right corner shows a thermal fluorescence intensity scale. (E) Quantification of HNE fluorescence intensity. Values represent mean ± SD for 100–120 cells per experimental condition, N = 3 independent experiments, *** p < 0.001.
Figure 4
Figure 4
RSL3 decreases Bcl-2 levels but does not induce Caspase-3 cleavage. Extracts of cells treated with 5 µM RSL3 for different times, or with 5 µM thapsigargin (Thapsig) for 8 h, were analyzed by Western blot to evaluate Bcl-2 and cleaved Caspase-3 levels. Actin was used as a loading control. (A) Image of a representative blot. (B) Densitometric quantification of Bcl-2/Actin levels normalized to control. (C) Densitometric quantification of cleaved Caspase-3/Actin levels normalized to control. after treatment with RSL3 for different times, or with 5 µM thapsigargin for 16 h. Mean ± SEM values are shown. N = 3 independent experiments; ns = not significant, ** p < 0.01, *** p < 0.001.
Figure 5
Figure 5
RSL3 alters calcium concentrations after a delay period. (A) Cells pre-treated with 5 µM RSL3 for different times were loaded with fura-2 and fluorescence was recorded to subsequently determine cytoplasmic calcium concentrations. Values represent mean ± SEM of a representative experiment from 3 independent experiments with 3 replicates per experimental condition. Differences were determined by one-way ANOVA followed by Dunnett’s post hoc test. (B) Cells pre-treated with 5 µM RSL3 or vehicle (DMSO, control) were loaded with fluo-3 and fluorescence was recorded. Representative images of each treatment are shown. Scale bar 20 µm. (C) Quantification of cell fluorescence after the different treatments. Values are given as mean ± SEM; 40 cells per condition. (D) Plots of the ratio of fluorescence intensity over initial fluorescence (F/F0) as a function of time, before and after the addition of ionomycin (arrow). (E) Maximum F/F0 ratio reached after the addition of ionomycin for each condition. Mean ± SEM of the last three points for each experimental condition with points in triplicate. ns = not significant; ** p < 0.01; *** p < 0.001.
Figure 6
Figure 6
Calcium chelation protects cells against RSL3-induced lipid peroxidation. Cells were pre-incubated for 1 h with 5 µM BAPTA-AM followed by co-incubation for 3 h with 5 µM RSL3 and analysis of lipid peroxidation with either BODIPY C11 or anti-HNE immunofluorescence as described in Methods. (A) Representative images of BODIPY fluorescence upon treatment with RSL3, without (control) or after pre-treatment with BAPTA-AM. Scale bar 20 µm. (B) Quantification of the ratio of fluorescence intensity of the oxidized (green) channel to that of the reduced (red) channel. At least 80 cells per condition were quantified from N = 3 independent experiments. Mean ± SD values are shown. (C) Representative images of immunodetection against 4-HNE adducts. Scale bar 15 µm. (D) Quantification of fluorescence intensity. Values represent mean ± SD from 75–90 cells quantified for each experimental condition from N = 3 independent experiments. Both in (B,D) differences were evaluated by one-way ANOVA, followed by Dunnett’s post hoc test. *** p < 0.001.
Figure 7
Figure 7
Both BAPTA and DFO protect against RSL3-induced decrease in cell viability. Cells were incubated for 90 min with 300 µM Verapamil (Verap), 5 µM Nifedipine (Nifed) or 100 µM CoCl2 (A) or with 25 µM DFO, 2.5 mM EGTA or 2.5 µM BAPTA-AM (B), followed by incubation for 4 h with 5 µM RSL3. After that, cell viability was estimated by the MTT assay. Values represent mean ± SEM. N = 3 independent experiments with determinations done in sextuplicate. Differences were assessed by one-way ANOVA followed by Dunnett’s test. *** p < 0.001 compared to RSL3 alone treatment; ns = not significant.
Figure 8
Figure 8
The role of IP3R channels in RSL3-induced ferroptosis. (A) SH-SY5Y cells were pre-incubated for 1 h with 100 µM Ryanodine, 10 µM xestospongin B (XeB) or 1 mM carbachol (Cch) and were then incubated for 4 h with RSL3. Viability was determined by the MTT assay; ns = not significant, *** p < 0.001. (B) Representative Western blots against IP3R1 after Cch treatments for 0, 1, 4 or 6 h. (C) Quantification of relative protein levels of IP3R1 after Cch treatment. Values represent the mean ± SD from N = 3 independent experiments; *** p < 0.001 compared to Control.
Figure 9
Figure 9
Knockdown of IP3R1 reduces the increase in intracellular calcium concentration induced by RSL3. Cells previously transfected with a shRNA construct against IP3R1 with a RFP tag (RFP+) were treated for 4 h with 5 µM RSL3 or vehicle, then loaded with fluo-3 and frames were obtained with red and green fluorescence filters. (A) Representative images in thermal scale of non-treated cells (columns 1 and 2) and RSL3-treated cells (columns 3 and 4). Scale bar 20 µm. White (Fluo-3) and black (Phase) arrowheads mark the position of RFP-positive cells. (B) Quantification of fluo-3 fluorescence in RFP+ cells, which corresponds to IP3R1 shRNA transfected cells, and RFP- cells, which do not express the IP3R1 construct, without (RSL3-) or with (RSL3+) RSL3 treatment. (C) Estimation of roundness in RFP+ and RFP- cells treated or not with RSL3. Values represent mean ± SEM. Between 32 and 115 cells were evaluated per experimental condition from 2 independent experiments. *** p = 0.001 comparing the RFP-/RSL3+ and the RFP-/RSL3+ conditions. No significant changes were detected between the RFP-/RSL3-, RFP+/RSL3- and RFP+/RSL3+ conditions.
Figure 10
Figure 10
RSL3 induces an increase in mitochondrial calcium levels. Cells transfected with the mitochondrial calcium sensor CEPIA2mt were treated with 5 µM RSL3 for 4 h or with control solution, and the fluorescence intensity was recorded. (A) Representative images of both conditions shown in thermal scale (right-hand bar). Size bar 30 µm. (B) Quantification of fluorescence intensity. Values represent Mean ± SEM from 58–62 cells quantified for each experimental condition. Difference between mean values was determined by unpaired two-tail t-test. N = 2 independent experiments. *** p < 0.001.
Figure 11
Figure 11
The effect of RSL3-induced ferroptosis on intracellular calcium dynamics in SH-SY5Y cells. ER, endoplasmic reticulum; Mit, mitochondria; ROS, reactive oxygen species; DFO, iron chelator deferoxamine; MCU, mitochondrial calcium uniporter; LOXs, lipoxygenases; IP3, inositol 1,4,5-trisphosphate; IP3R, IP3 receptor; PLC, Phospholipase C; XeB, xestospongin B; Cch, carbachol. Figure created with BioRender.com.

References

    1. Galluzzi L., Vitale I., Aaronson S.A., Abrams J.M., Adam D., Agostinis P., Alnemri E.S., Altucci L., Amelio I., Andrews D.W., et al. Molecular mechanisms of cell death: Recommendations of the Nomenclature Committee on Cell Death 2018. Cell Death Differ. 2018;25:486–541. doi: 10.1038/s41418-017-0012-4. - DOI - PMC - PubMed
    1. Dixon S.J., Lemberg K.M., Lamprecht M.R., Skouta R., Zaitsev E.M., Gleason C.E., Patel D.N., Bauer A.J., Cantley A.M., Yang W.S., et al. Ferroptosis: An iron-dependent form of nonapoptotic cell death. Cell. 2012;149:1060–1072. doi: 10.1016/j.cell.2012.03.042. - DOI - PMC - PubMed
    1. Yang W.S., Stockwell B.R. Synthetic lethal screening identifies compounds activating iron-dependent, nonapoptotic cell death in oncogenic-RAS-harboring cancer cells. Chem. Biol. 2008;15:234–245. doi: 10.1016/j.chembiol.2008.02.010. - DOI - PMC - PubMed
    1. Hu S., Chu Y., Zhou X., Wang X. Recent advances of ferroptosis in tumor: From biological function to clinical application. Biomed. Pharmacother. 2023;166:115419. doi: 10.1016/j.biopha.2023.115419. - DOI - PubMed
    1. Ryan S.K., Ugalde C.L., Rolland A.S., Skidmore J., Devos D., Hammond T.R. Therapeutic inhibition of ferroptosis in neurodegenerative disease. Trends Pharmacol. Sci. 2023;44:674–688. doi: 10.1016/j.tips.2023.07.007. - DOI - PubMed

LinkOut - more resources