. 2024 Feb 4;13(2):200.
doi: 10.3390/antiox13020200.

Redox Biomarkers and Matrix Remodeling Molecules in Ovarian Cancer

Affiliations

Redox Biomarkers and Matrix Remodeling Molecules in Ovarian Cancer

Elżbieta Supruniuk et al. Antioxidants (Basel). .

Abstract

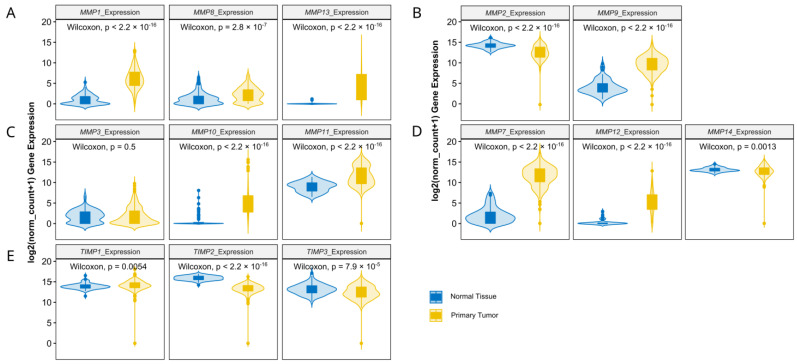
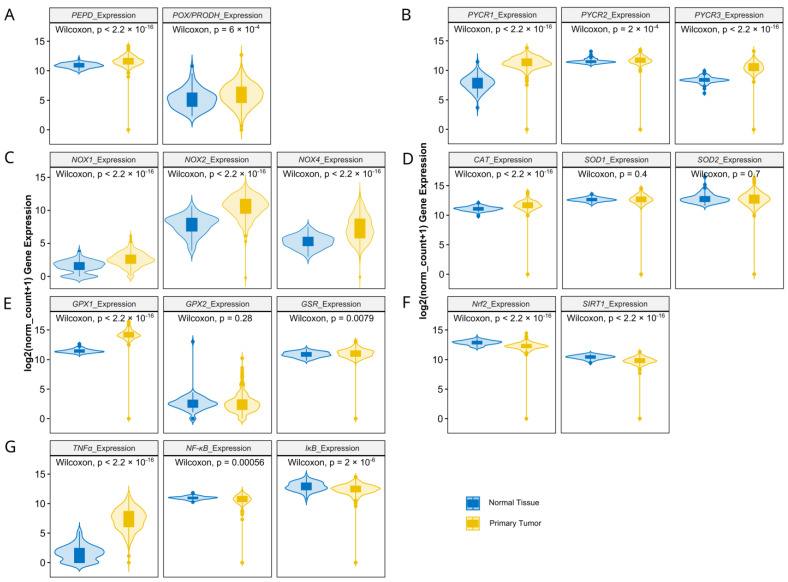
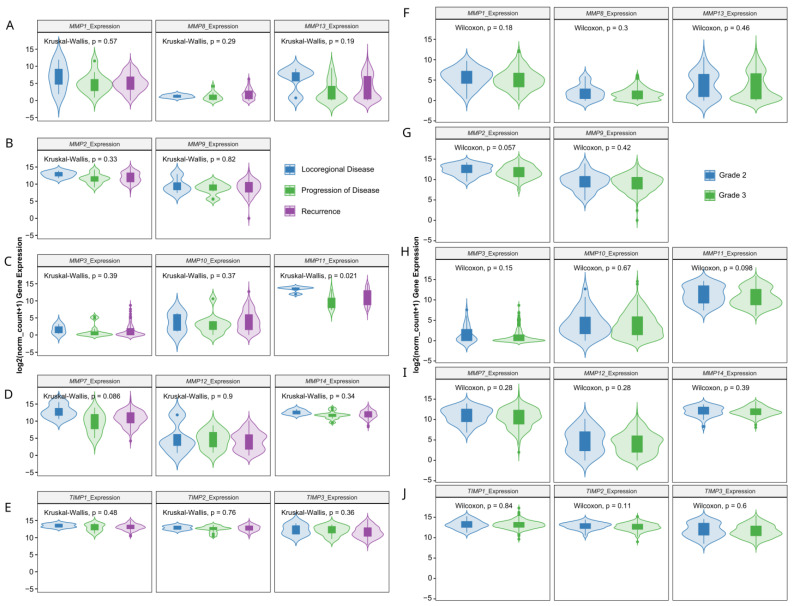
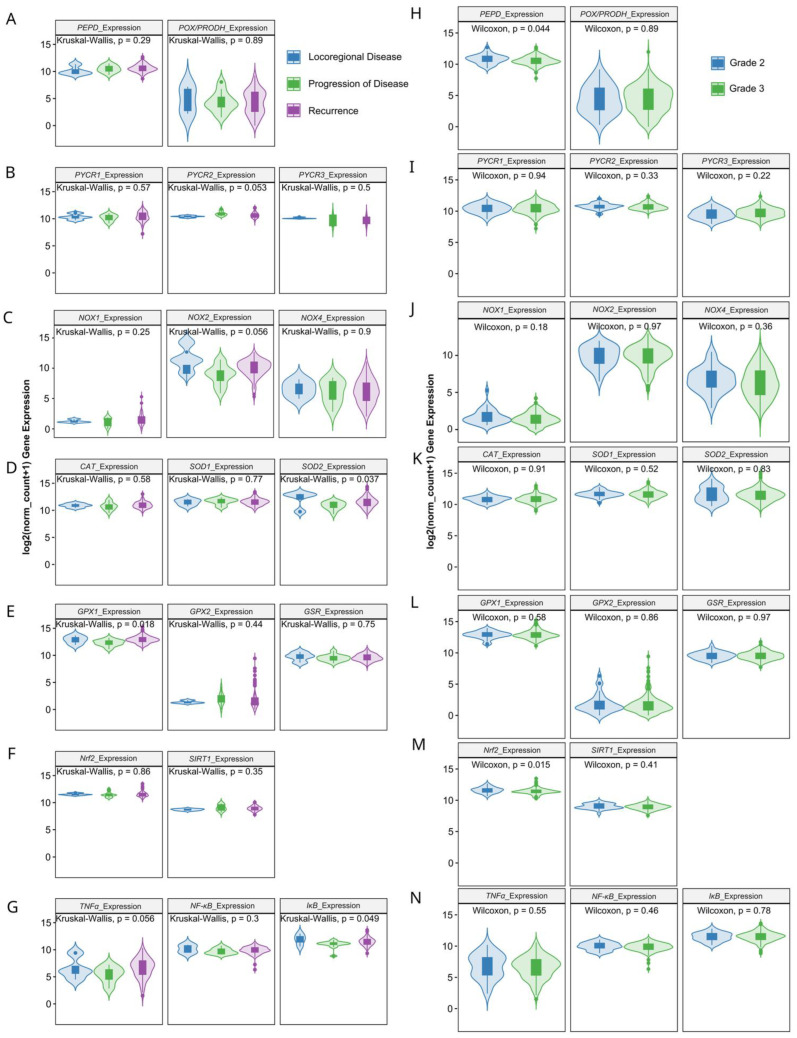
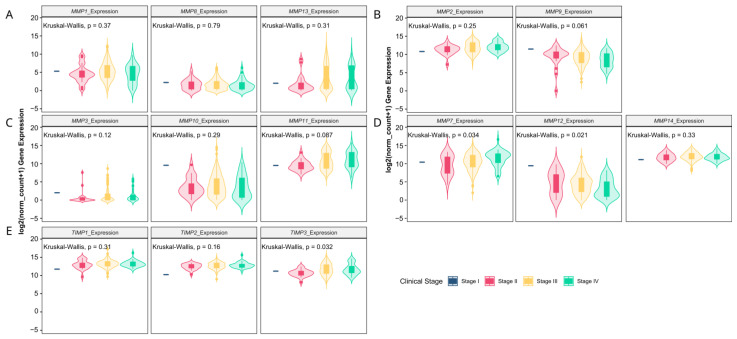
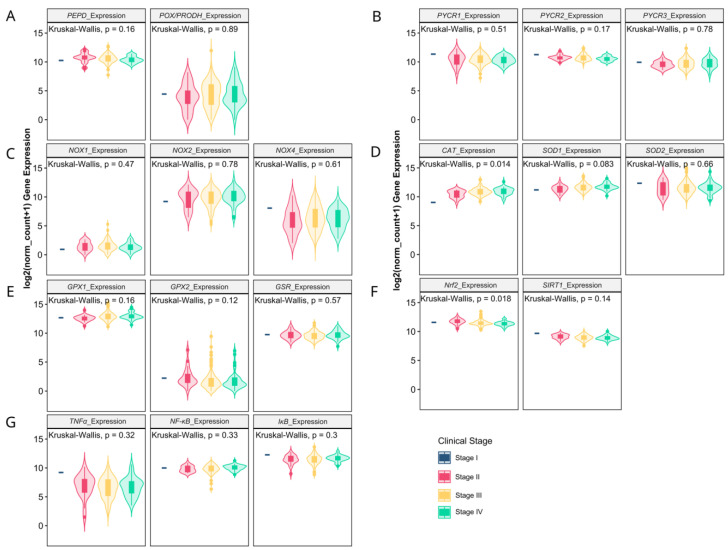
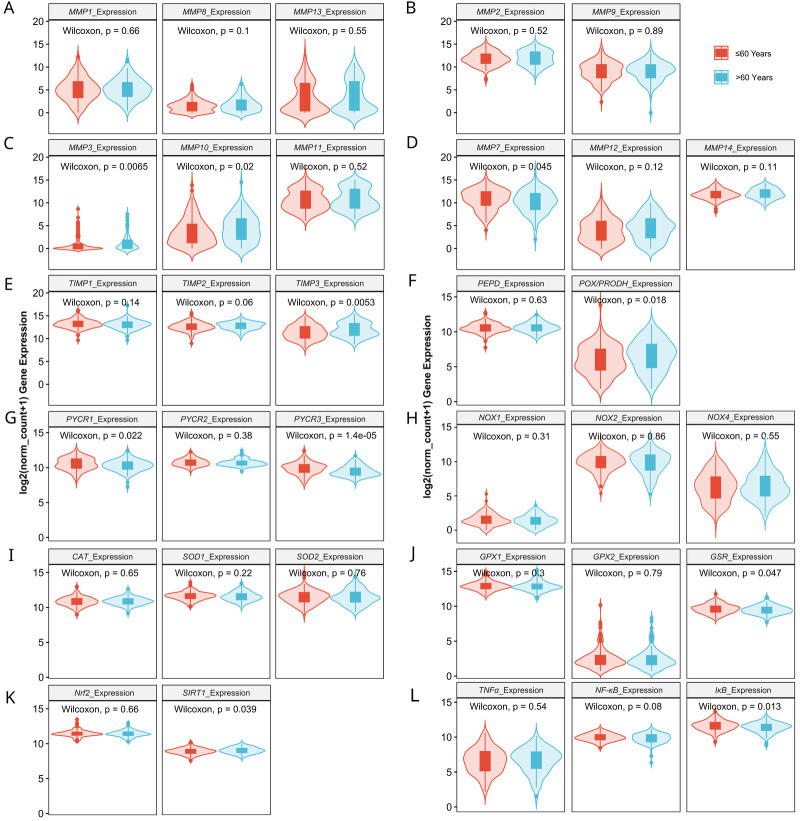
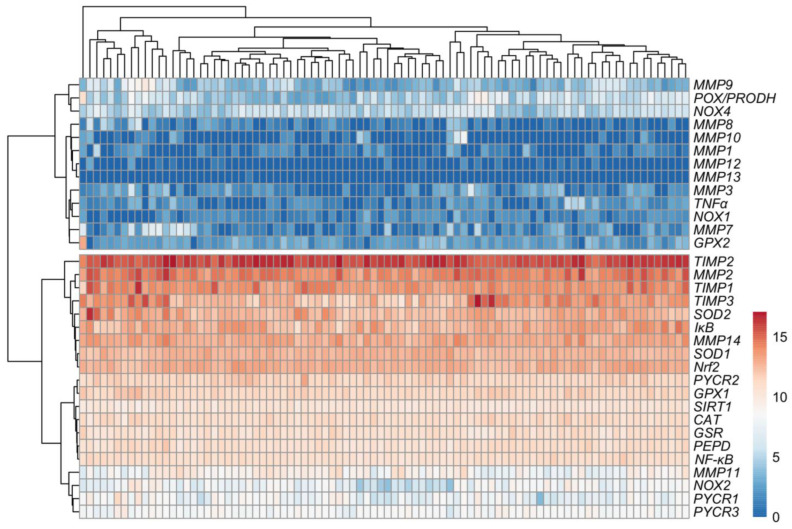
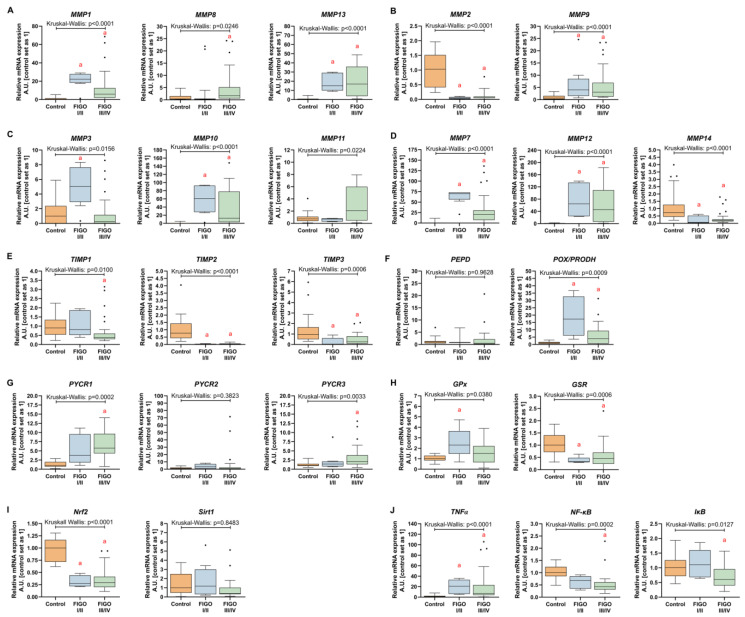
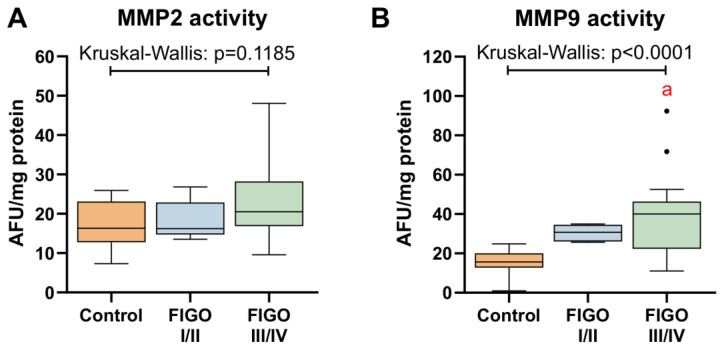
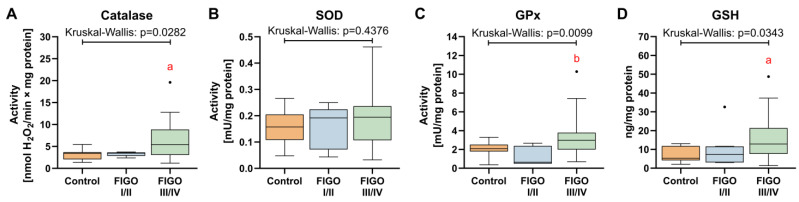
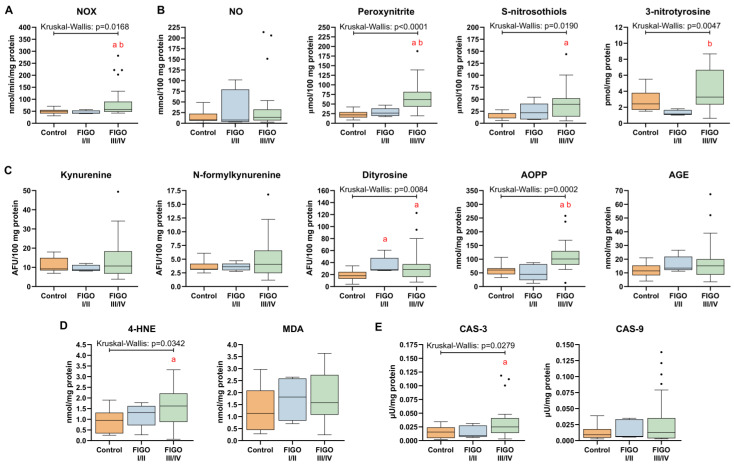
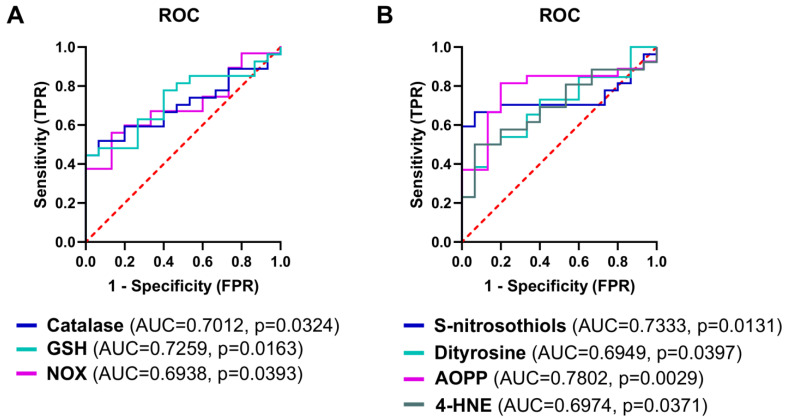
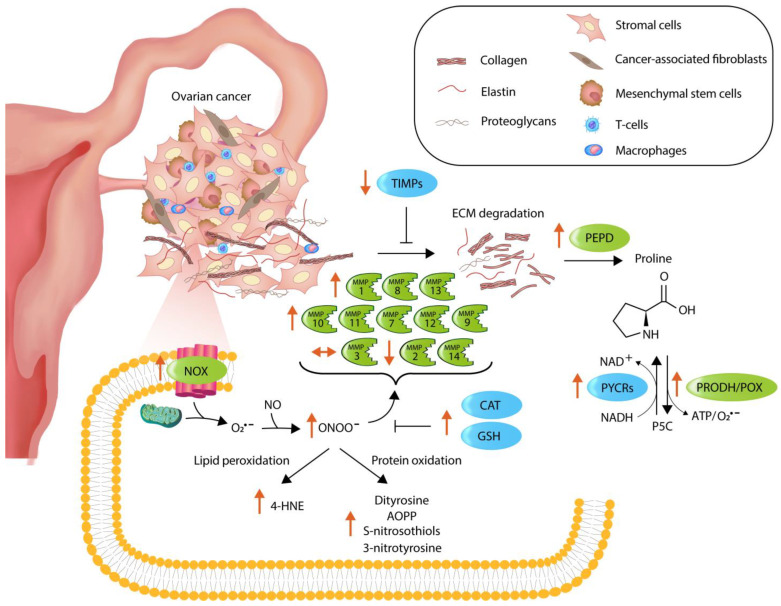
Ovarian cancer (OC) has emerged as the leading cause of death due to gynecological malignancies among women. Oxidative stress and metalloproteinases (MMPs) have been shown to influence signaling pathways and afflict the progression of carcinogenesis. Therefore, the assessment of matrix-remodeling and oxidative stress intensity can determine the degree of cellular injury and often the severity of redox-mediated chemoresistance. The study group comprised 27 patients with serous OC of which 18% were classified as Federation of Gynecology and Obstetrics (FIGO) stages I/II, while the rest were diagnosed grades III/IV. The control group comprised of 15 ovarian tissue samples. The results were compared with genetic data from The Cancer Genome Atlas. Nitro-oxidative stress, inflammation and apoptosis biomarkers were measured colorimetrically/fluorometrically or via real-time PCR in the primary ovarian tumor and healthy tissue. Stratification of patients according to FIGO stages revealed that high-grade carcinoma exhibited substantial alterations in redox balance, including the accumulation of protein glycoxidation and lipid peroxidation products. TCGA data demonstrated only limited prognostic usefulness of the studied genes. In conclusion, high-grade serous OC is associated with enhanced tissue oxidative/nitrosative stress and macromolecule damage that could not be overridden by the simultaneously augmented measures of antioxidant defense. Therefore, it can be assumed that tumor cells acquire adaptive mechanisms that enable them to withstand the potential toxic effects of elevated reactive oxygen species.

Keywords: apoptosis; inflammation; nitrosative stress; ovarian neoplasms; oxidative stress.


Conflict of interest statement

The authors declare no conflict of interest.

Figures

Figure 1
Figure 1
Collagenases (A), gelatinases (B), stromelysins (C), other MMPs (D) and TIMPs (E) gene expression comparison between TCGA ovarian cancer data and GTEx control group. The number of samples per group were 427 and 88 for the ovarian carcinoma and control tissue, respectively.
Figure 2
Figure 2
Proline metabolism-related (A,B), NOXs (C), antioxidative (DF) and inflammatory (G) gene expression comparison by clinical stages of ovarian cancer based on TCGA data. The number of samples per group were 427 and 88 for the ovarian carcinoma and control tissue, respectively.
Figure 3
Figure 3
MMPs and TIMPs gene expression comparison in TCGA ovarian cancer dataset by neoplasm type (AE) and tumor grade (FJ). The number of samples per group were 4, 12 and 142 for locoregional disease, progression of disease and recurrence, respectively. Grade 2 cancer encompassed 33 patients, while grade 3 included 260 tissue samples.
Figure 4
Figure 4
Proline metabolism-related (A,B,H,I), NOXs (C,J), antioxidative (DF,KM) and inflammatory (G,N) gene expression comparison in TCGA ovarian cancer dataset by neoplasm type (AG) and tumor grade (HN). The number of samples per group were 4, 12 and 142 for locoregional disease, progression of disease and recurrence, respectively. Grade 2 cancer encompassed 33 patients, while grade 3 included 260 tissue samples.
Figure 5
Figure 5
Collagenases (A), gelatinases (B), stromelysins (C), other MMPs (D) and TIMPs (E) gene expression comparison by clinical stages of ovarian cancer based on TCGA data. The number of samples per group were 1, 21, 241 and 38 for the stages I, II, III and IV, respectively.
Figure 6
Figure 6
Proline metabolism-related (A,B), NOXs (C), antioxidative (DF) and inflammatory (G) gene expression comparison by clinical stages of ovarian cancer based on TCGA data. The number of samples per group were 1, 21, 241 and 38 for the stages I, II, III and IV, respectively.
Figure 7
Figure 7
MMPs (AD), TIMPs (E), proline metabolism-related (F,G), NOXs (H), antioxidative (IK) and inflammatory (L) gene expression comparison by patients age in ovarian cancer based on TCGA data. The number of samples per group were 175 and 128 for the ages ≤ 60 and >60, respectively.
Figure 8
Figure 8
Expression profiles in control samples (n = 88) based on GTEx data.
Figure 9
Figure 9
Expression profiles in ovarian cancer samples (n = 308) based on TCGA data.
Figure 10
Figure 10
Spearman’s correlation between mRNA levels of selected genes in control ovarian samples based on GTEx data (n = 88).
Figure 11
Figure 11
Spearman’s correlation between mRNA levels of selected genes in ovarian carcinoma samples based on TCGA data (n = 308).
Figure 12
Figure 12
Kaplan-Meier curves of significant overall (A) and progression-free survival (B) by the matrix- and oxidative stress-associated genes level based on TCGA dataset. OC samples were assigned into two separate groups depending on whether target expression of each sample is higher (high expression) or lower (low expression) than the median. n: number of patients.
Figure 13
Figure 13
Comparison between matrix-remodeling related genes and redox-associated genes in the control ovarian tissue, and ovarian carcinoma FIGO I/II and FIGO III/IV. (A) collagenases (MMP-1, MMP-8, MMP-13); (B) gelatinases (MMP-2 and MMP-9); (C) stromelysins (MMP-3, MMP-10, MMP-13); (D) other MMPs (MMP-7, MMP-12, MMP-14); (E) TIMPs; (F) prolidase and proline oxidase; (G) proline-synthesizing enzymes; (H) glutathione metabolism-related genes; (I) antioxidative signaling pathways-activating genes; (J) inflammatory genes. The number of patients in the control FIGO I/II and FIGO III/IV groups was 15, five and 25, respectively. The results are presented in the form of box–whisker plots with dots to represent the outliers. Significance marker: ‘a’ indicates different vs. control (p < 0.05).
Figure 14
Figure 14
Comparison between (A) MMP2 and (B) MMP9 activity in control ovarian tissue, and ovarian carcinoma FIGO I/II and FIGO III/IV. The number of patients in the control FIGO I/II and FIGO III/IV groups was 15, five and 22, respectively. The results were presented in the form of box–whisker plots with dots to represent the outliers. Significance markers: ‘a’ indicates different vs. control (p < 0.05).
Figure 15
Figure 15
Comparison between biomarkers of antioxidative defense in control ovarian tissue, and ovarian carcinoma FIGO I/II and FIGO III/IV. (A) Catalase activity; (B) superoxide dismutase activity; (C) glutathione peroxidase activity; and (D) glutathione concentration. The number of patients in the control FIGO I/II and FIGO III/IV groups was 15, five and 22, respectively. The results were presented in the form of box–whisker plots with dots to represent the outliers. Significance markers: ‘a’ indicates different vs. control (p < 0.05) and ‘b’ indicates different vs. FIGO I/II (p < 0.05).
Figure 16
Figure 16
Comparison between pro-oxidative biomarkers in control ovarian tissue, and ovarian carcinoma FIGO I/II and FIGO III/IV. (A) NADPH oxidase (NOX) activity; (B) indices of nitrosative stress; (C) products of protein glycoxidation; (D) products of lipid peroxidation; (E) caspase 3 and caspase 9 activities. The number of patients in the control FIGO I/II and FIGO III/IV groups was 15, five and 22, respectively. The results were presented in the form of box–whisker plots with dots to represent the outliers. Significance markers: ‘a’ indicates different vs. control (p < 0.05) and ‘b’ indicates different vs. FIGO I/II (p < 0.05). Abbreviations: 4-HNE: 4-hydroxynonenal; AGE: advanced glycation end-products of proteins; AOPP: advanced oxidation protein products; MDA: malondialdehyde; NO: nitric oxide.
Figure 17
Figure 17
The receiver operating characteristic (ROC) analysis in HGSOC patients for the prediction of HGSOC occurrence. (A) The diagnostic value of antioxidant and prooxidant systems. (B) The diagnostic value of oxidative/nitrosative damage biomarkers. Only statistically significant changes are included. The number of patients in the control and ovarian cancer groups was 15 and 30, respectively.
Figure 18
Figure 18
Summary of alterations in matrix remodeling- and oxidative stress-associated markers in ovarian cancer FIGO III/IV. Enzymes accelerating the above processes are in green boxes, whereas blue boxes represent antagonistic molecules. Orange arrows depict how the level of the examined factors has changed in comparison to unaffected ovarian tissue. Black arrows (➝) indicate the direction of process, while ⊢ symbolizes the inhibition.

Similar articles

Cited by

References

    1. Huang J., Chan W.C., Ngai C.H., Lok V., Zhang L., Lucero-Prisno D.E., Xu W., Zheng Z.J., Elcarte E., Withers M., et al. Worldwide Burden, Risk Factors, and Temporal Trends of Ovarian Cancer: A Global Study. Cancers. 2022;14:2230. doi: 10.3390/cancers14092230. - DOI - PMC - PubMed
    1. Kuroki L., Guntupalli S.R. Treatment of epithelial ovarian cancer. BMJ. 2020;371:m3773. doi: 10.1136/bmj.m3773. - DOI - PubMed
    1. Reid B.M., Permuth J.B., Sellers T.A. Epidemiology of ovarian cancer: A review. Cancer Biol. Med. 2017;14:9–32. doi: 10.20892/j.issn.2095-3941.2016.0084. - DOI - PMC - PubMed
    1. Desai A., Xu J., Aysola K., Qin Y., Okoli C., Hariprasad R., Chinemerem U., Gates C., Reddy A., Danner O., et al. Epithelial ovarian cancer: An overview. World J. Transl. Med. 2014;3:1. doi: 10.5528/wjtm.v3.i1.1. - DOI - PMC - PubMed
    1. Ledermann J.A., Raja F.A., Fotopoulou C., Gonzalez-Martin A., Colombo N., Sessa C. Newly diagnosed and relapsed epithelial ovarian carcinoma: ESMO clinical practice guidelines for diagnosis, treatment and follow-up. Ann. Oncol. 2013;24:vi24–vi32. doi: 10.1093/annonc/mdt333. - DOI - PubMed

LinkOut - more resources