. 2024 Jan 25;12(2):273.
doi: 10.3390/biomedicines12020273.

Analysis of Potential Vitamin D Molecule Biomarkers: Association of Calcitriol and Its Hydroxylation Efficiency Ratio with Cardiovascular Disease Risk in Rheumatoid Arthritis Patients

Affiliations

Analysis of Potential Vitamin D Molecule Biomarkers: Association of Calcitriol and Its Hydroxylation Efficiency Ratio with Cardiovascular Disease Risk in Rheumatoid Arthritis Patients

Melissa Rivera-Escoto et al. Biomedicines. .

Abstract

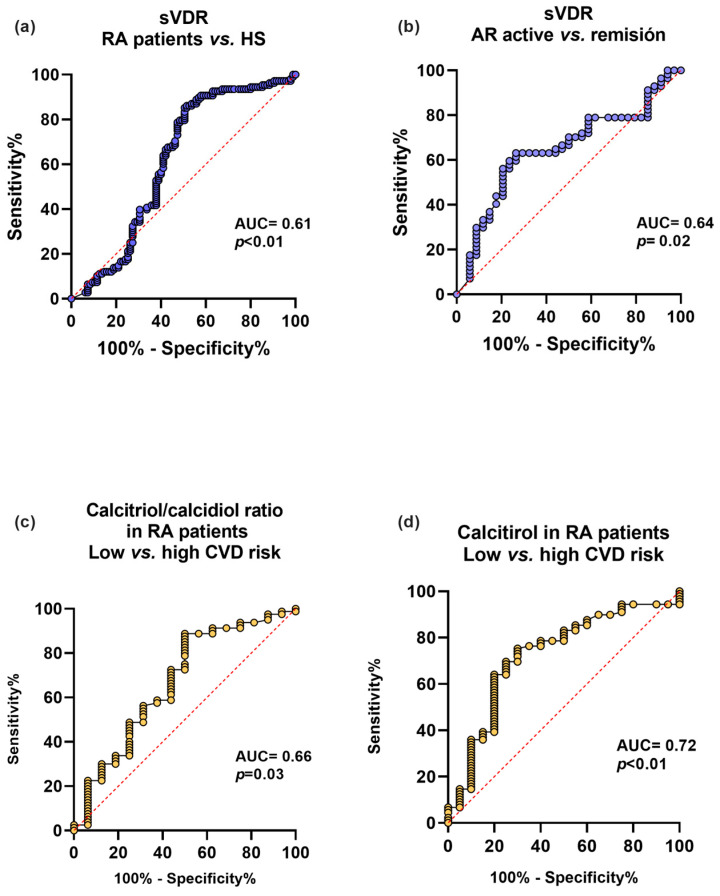
Rheumatoid arthritis (RA) is a multifactorial autoimmune disease in which hypovitaminosis D by calcidiol quantification has been associated with disease severity. However, other vitamin D molecules could be implicated in RA pathophysiology and its comorbidities such as cardiovascular disease (CVD), which impacts the severity and mortality of RA patients. This study aimed to assess the relationship between calcidiol, calcitriol, its hydroxylation efficiency ratio, and the soluble vitamin D receptor (sVDR) and clinical and CVD risk variables to propose potential vitamin D molecule biomarkers for RA. A cross-sectional study of females was conducted on 154 RA patients and 201 healthy subjects (HS). Calcidiol, calcitriol, and the sVDR were measured in blood serum, and vitamin D hydroxylation efficiency was estimated using the calcitriol/calcidiol ratio score. CVD risk was calculated by the high-sensitivity C-reactive protein (hs-CRP) cutoff values. Disease activity was evaluated with the Disease Activity Score for 28 standard joints (DAS28-CRP). Results: The hydroxylation efficiency ratio and calcitriol serum levels were higher in RA patients with hypovitaminosis D (p < 0.001). Moreover, RA patients had a higher probability of a high hydroxylation efficiency ratio (OR = 2.02; p = 0.02), calcitriol serum levels (OR = 2.95; p < 0.001), and sVDR serum levels (OR = 5.57; p < 0.001) than HS. This same pattern was also observed in RA patients with high CVD risk using CRP serum levels; they showed a higher hydroxylation efficiency ratio (OR = 4.51; p = 0.04) and higher calcitriol levels (OR = 5.6; p < 0.01). Calcitriol correlates positively with the sVDR (r = 0.21, p = 0.03), CRP (r = 0.28, p < 0.001), and cardiometabolic indexes (p < 0.001) also showed discrimination capacity for CVD risk in RA patients with CRP ≥ 3 mg/L (AUC = 0.72, p < 0.01). In conclusion, hypovitaminosis D in RA patients was characterized by a pattern of a higher hydroxylation efficiency ratio and higher calcitriol and sVDR serum levels. Notably, higher calcitriol serum levels and a higher vitamin D hydroxylation efficiency ratio were associated with higher CVD risk in RA patients.

Keywords: C-reactive protein; CVD risk; calcidiol; calcitriol; rheumatoid arthritis; soluble vitamin D receptor.


Conflict of interest statement

The authors declare no conflicts of interest.

Figures

Figure 1
Figure 1
Vitamin D molecules serum levels in RA patients and HS stratified by calcidiol categories. (a) Calcidiol serum levels in RA patients vs. HS. (b) Calcitriol/calcidiol ratio in RA patients vs. HS. (c) Calcitriol serum levels in RA vs. HS. (d) sVDR serum levels in RA vs. HS. (e) Calcitriol/calcidiol ratio score in RA patients and HS stratified by calcidiol categories. (f) Calcitriol serum levels in RA patients and HS stratified by calcidiol categories. Data shown as median and p5th–p95th percentiles. * p value: U Mann–Whitney test and ** p value Kruskal–Wallis test. sVDR: soluble vitamin D receptor; RA: Rheumatoid arthritis; HS: Healthy subjects.
Figure 2
Figure 2
Correlations of anthropometrical, biochemical, and cardiometabolic variables and vitamin D metabolites with the sVDR, vitamin D hydroxylation efficiency ratio, and calcitriol serum levels in RA patients. Spearman correlation coefficients are represented as connecting lines between the anthropometrical, biochemical, cardiometabolic variables, and vitamin D metabolites (top rainbow) and the sVDR, calcitriol/calcidiol ratio, and calcitriol (bottom rainbow). Only significant correlations with a p-value < 0.05 are shown.. The width of lines represents the value of the correlation coefficients (measured with scale). For all the correlation analyses, see Supplementary Table S3. sVDR: soluble vitamin D receptor; Ratio: Hydroxylation efficiency ratio; WHR: Waist-to-hip ratio; TC: Total cholesterol; TG: Triglycerides; LDL-C: Low-density lipoprotein cholesterol; CRP: C-reactive protein; TG/HDL-C: Triglycerides/HDL-C index.
Figure 3
Figure 3
Vitamin D molecules stratified according to CVD risk by CRP and clinical variables in RA patients. (a) Calcitriol/calcidiol ratio stratified by CVD risk using CRP serum levels (>3 mg/L). (b) Calcitriol serum levels stratified by CVD risk using CRP serum levels (≥3 mg/L). (c) sVDR level stratified by clinical activity and remission in RA patients. (d) sVDR level stratified by number of tender joints in RA patients. Data are shown as median and p5th–p95th percentile. p-value: Mann–Whitney U test. CRP: C-reactive protein; sVDR: Soluble vitamin D receptor; RA: Rheumatoid arthritis; HS: Healthy subjects; DAS28: Disease Activity Score 28 joints.
Figure 4
Figure 4
Discriminatory capacity of the sVDR, calcitriol, and its hydroxylation efficiency ratio for the disease, clinical activity, and CVD in RA patients. (a) Discriminatory ROC curve between RA patients and HS. (b) Discriminatory ROC curve for active vs. remission disease activity in RA patients. (c) Calcitriol/calcidiol ratio discriminatory ROC curve for low CVD disease risk (<3 mg/L) and high CVD risk (≥3 mg/L) in RA patients. (d) Calcitriol discriminatory ROC curve for low CVD risk (<3 mg/L) and high CVD risk (≥3 mg/L) in RA patients. Blue lines: ROC curves with sVDR. Yellow lines: ROC curves with calcitriol/calcidiol ratio and calcitriol. sVDR: soluble vitamin D receptor. AUC = area under the curve.

Similar articles

Cited by

References

    1. Smolen J.S., Aletaha D., Barton A., Burmester G.R., Emery P., Firestein G.S., Kavanaugh A., McInnes I.B., Solomon D.H., Strand V., et al. Rheumatoid arthritis. Nat. Rev. Dis. Primers. 2018;4:18001. doi: 10.1038/nrdp.2018.1. - DOI - PubMed
    1. Herrmann M., Farrell C.-J.L., Pusceddu I., Fabregat-Cabello N., Cavalier E. Assessment of vitamin D status—A changing landscape. Clin. Chem. Lab. Med. (CCLM) 2017;55:3–26. doi: 10.1515/cclm-2016-0264. - DOI - PubMed
    1. Alonso N., Zelzer S., Eibinger G., Herrmann M. Vitamin D Metabolites: Analytical Challenges and Clinical Relevance. Calcif. Tissue Int. 2022;112:158–177. doi: 10.1007/s00223-022-00961-5. - DOI - PMC - PubMed
    1. Athanassiou L., Kostoglou-Athanassiou I., Koutsilieris M., Shoenfeld Y. Vitamin D and Autoimmune Rheumatic Diseases. Biomolecules. 2023;13:709. doi: 10.3390/biom13040709. - DOI - PMC - PubMed
    1. De La Guía-Galipienso F., Martínez-Ferran M., Vallecillo N., Lavie C.J., Sanchis-Gomar F., Pareja-Galeano H. Vitamin D and cardiovascular health. Clin. Nutr. 2021;40:2946–2957. doi: 10.1016/j.clnu.2020.12.025. - DOI - PMC - PubMed