. 2024 Feb 6;16(4):694.
doi: 10.3390/cancers16040694.

Cancer Cell Biomechanical Properties Accompany Tspan8-Dependent Cutaneous Melanoma Invasion

Affiliations

Cancer Cell Biomechanical Properties Accompany Tspan8-Dependent Cutaneous Melanoma Invasion

Gaël Runel et al. Cancers (Basel). .

Abstract

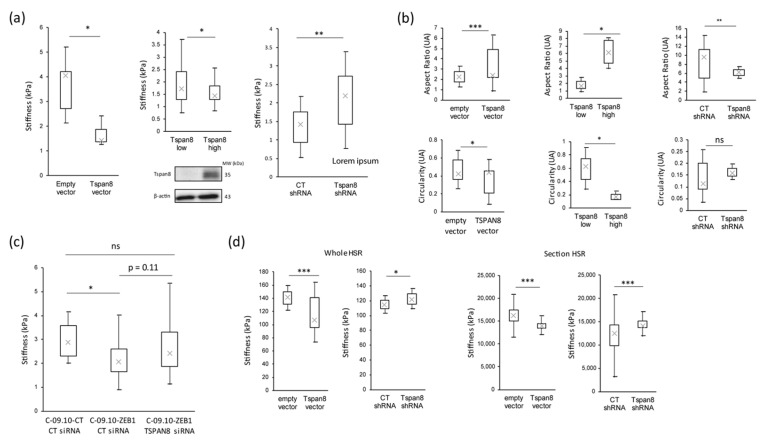
The intrinsic biomechanical properties of cancer cells remain poorly understood. To decipher whether cell stiffness modulation could increase melanoma cells' invasive capacity, we performed both in vitro and in vivo experiments exploring cell stiffness by atomic force microscopy (AFM). We correlated stiffness properties with cell morphology adaptation and the molecular mechanisms underlying epithelial-to-mesenchymal (EMT)-like phenotype switching. We found that melanoma cell stiffness reduction was systematically associated with the acquisition of invasive properties in cutaneous melanoma cell lines, human skin reconstructs, and Medaka fish developing spontaneous MAP-kinase-induced melanomas. We observed a systematic correlation of stiffness modulation with cell morphological changes towards mesenchymal characteristic gains. We accordingly found that inducing melanoma EMT switching by overexpressing the ZEB1 transcription factor, a major regulator of melanoma cell plasticity, was sufficient to decrease cell stiffness and transcriptionally induce tetraspanin-8-mediated dermal invasion. Moreover, ZEB1 expression correlated with Tspan8 expression in patient melanoma lesions. Our data suggest that intrinsic cell stiffness could be a highly relevant marker for human cutaneous melanoma development.

Keywords: EMT-TFs; biomechanics; melanoma; stiffness; tetraspanin 8.


Conflict of interest statement

The authors declare no conflicts of interest.

Figures

Figure 1
Figure 1
Melanoma transformation and progression are associated with stiffness decrease. (a) (Top left panel), overall stiffness measurement of whole human skin reconstructs (HSR) containing primary melanocytes (NHM) or melanoma cells. (Top right panel), stiffness measurement of melanoma cells in HSR cryosections. (Bottom panels), imaging of the corresponding HSR sections. (b) Global measurement of skin stiffness of medaka fish mitf::Xmrk/+ (left panel) or mitf::Xmrk/+ p53-/- (right panel) on healthy areas compared to areas with melanoma. Stiffness measurements were conducted on the flank or in dorsal areas of medakas. (c) (Upper left panel), optical and mechanical correlative images showing the rigidity of the skin at the interface between healthy area (white area (optical)) and melanoma area (black area (optical)) of the whole mitf::Xmrk/+ medaka. (Bottom left panel), tomographic reconstruction of the area scanned by AFM (projection in xz). (Right panel), optical and mechanical correlative image showing the stiffness of the skin at the interface between healthy and tumoral areas of cryosections from mitf::Xmrk/+ medaka. Blue corresponds to the lowest stiffness and red to the highest. (d) (Left panel), graphical representation of the stiffness of mitf::Xmrk/+ medaka (on tumoral areas) during melanoma progression. (Upper right panel), pictures of mitf::Xmrk/+ medaka with, respectively, from left to right, preneoplastic naevus to advanced invasive melanoma. (Bottom right panel), representative graph of the ratio between tumoral and healthy areas of mitf::Xmrk/+ medaka at different stages of tumor progression. Statistical significance of stiffness measurements was assessed by two-tailed Student’s t-test or Wilcoxon test, depending on the normality of the paired samples. Mean differences were considered significant when p < 0.05 (* p < 0.05; ** p < 0.01; *** p < 0.001).
Figure 2
Figure 2
EMT-TF modulation regulates melanoma cell stiffness and morphological properties. (a) (Left panel), morphological analysis (area, solidity, aspect ratio, and circularity) of non-invasive (IC8) versus invasive (T1C3) melanoma cells in 2D culture. (Right panel), images of IC8 and T1C3 cells by confocal microscopy with the staining of actin (magenta) and nucleus (cyan). (b) Cellular morphological analysis (area, aspect ratio, and circularity) on human skin reconstructs (HSR) cryosection with non-invasive (IC8) and invasive (T1C3) melanoma cells. (c) ZEB1, N-cadherin, and E-cadherin expression measured by Western blot analysis in C-09.10 melanoma cells ectopically overexpressing ZEB1 (C-09.10-ZEB1) compared to the control condition (C-09.10-CT). (d) (Left panel), global stiffness measurement of C-09.10-CT versus C-09.10-ZEB1 melanoma cells. (Right panel), morphological analysis (aspect ratio and circularity) of C-09.10-CT and C-09.10-ZEB1 melanoma cells. (e) (Left panel), qPCR analysis of SNAI2, ZEB2, or ZEB1 transcript expression levels 72 h after SNAI2 (left graph), ZEB2 (right graph), or control (both graphs) siRNA transfection. (Right panel), ZEB2 and ZEB1 expression measured by Western blot analysis in T1C3 (upper right panel) or C-09.10 (lower right panel) melanoma cells 72 h after ZEB2 or control siRNA transfection. (f) (Left panel), global stiffness measurement of C-09.10 melanoma cells after control, SNAI2, or ZEB2 siRNA transfection. (Right panel), morphological analysis (aspect ratio and circularity) of C-09.10 melanoma cells after control, SNAI2, or ZEB2 siRNA transfection. GAPDH was used as a housekeeping gene in qPCR analysis, where data are shown as the mean ± SEM of three independent experiments, and β-actin was used as a loading control in Western blot analysis, where results are representative of two independent experiments. Statistical significance was assessed by two-tailed Student’s t-test or Wilcoxon test, depending on the normality of the paired samples. Mean differences were considered significant when p < 0.05 (* p < 0.05; ** p < 0.01; *** p < 0.001; ns non-significant). The original western blot figures can be found in File S1.
Figure 3
Figure 3
EMT-TFs regulate the expression of Tspan8, crucial for cutaneous melanoma invasion. (a) qPCR analysis of SNAI2, ZEB2, or TSPAN8 transcript expression levels 72 h after SNAI2 (left panel), ZEB2 (right panel), or control (both panels) siRNA transfection in non-invasive (IC8) or invasive (T1C3 and C-09.10) melanoma cells. (b) SNAI2, ZEB2, and Tspan8 expression measured by Western blot analysis 72 h after SNAI2 (left panel), ZEB2 (right panel), or control (both panels) siRNA transfection in T1C3 or C-09.10 melanoma cells. (c) (Top panel), qPCR analysis of TSPAN8 transcript expression level in C-09.10-ZEB1 compared to C-09.10-CT melanoma cells. (Bottom panel), ZEB1 and Tspan8 expression measured by Western blot analysis in C-09.10-CT and C-09.10-ZEB1 melanoma cells. (d) ZEB1 chromatin immunoprecipitation (ChIP) assays performed in C-09.10 melanoma cells, using IgG antibody as a negative control. Enrichment of TSPAN8 promoter region was analyzed by qPCR in comparison with a negative control promoter region located –1 kb upstream of the beginning of pTSPAN8 or a positive control using MITF promoter region. Results are representative of three independent experiments. (e) (Upper left panel), qPCR analysis of SNAI2, ZEB1, or TSPAN8 transcript expression levels in healthy skin, melanoma, or local metastasis conditions of mitf::Xmrk/+ medaka. (Upper right panel), ZEB1 and Tspan8 expression measured by Western blot analysis in healthy skin versus melanoma conditions of mitf::Xmrk/+ medaka. (Lower panel), Tspan8 staining in areas of invasive melanoma by immunohistochemistry on melanoma sections from a mitf::Xmrk/+ medaka fish, using a control antibody (serum before immunization, (left image) or a custom antibody directed against Tspan8 (serum after immunization, (right image). (f) (Left panel), quantification of Tspan8 expression level, based on the immunoscore previously established (47), in ZEB1low (n = 6) and ZEB1high (n = 7) melanoma samples. (Right panel), ZEB1 (top) and Tspan8 (bottom) expression analyzed by immunohistochemistry in ZEB1int melanoma samples (n = 5). GAPDH was used as a housekeeping gene in qPCR analysis, where data are shown as the mean ± SEM of three independent experiments, and β-actin was used as a loading control in Western blot analysis, where results are representative of two independent experiments. Statistical significance of qPCR data was assessed by two-tailed Student’s t-test for paired samples, where mean differences were considered significant when p < 0.05 (* p < 0.05; ** p < 0.01). The original western blot figures can be found in File S1.
Figure 4
Figure 4
Tspan8 modulation regulates stiffness and morphological properties of cutaneous melanoma cells. (a) Global stiffness measurements of different melanoma cell constructs according to their Tspan8 expression levels measured by Western blot analysis (bottom panels). (Top left panel), non-invasive melanoma cells with an empty vector versus melanoma cells with a vector allowing ectopic expression of Tspan8. (Top middle panel), melanoma cells expressing very low level of Tspan8 versus the enrichment of the same cells expressing Tspan8. (Top right panel), melanoma cells strongly expressing Tspan8 with a control shRNA compared to the same cells transfected with a shRNA directed against TSPAN8. (b) Morphological analysis (aspect ratio and circularity) of melanoma cells according to their Tspan8 expression profile in correlation with (a). (c) Global stiffness measurement of melanoma cells expressing or not expressing ZEB1 and Tspan8 according to the ectopic expression of ZEB1 and transfection of control or TSPAN8 siRNA. (d) Global stiffness measurement of melanoma cells expressing or not expressing Tspan8 in human skin reconstructs (HSR). (Left panel), measurement at the surface of whole HSR with cells not expressing Tspan8 and cells ectopically expressing Tspan8 (left), along with cells expressing Tspan8 against the same cells expressing a shRNA against Tspan8 (right). (Right panel), measurement of melanoma cells on cryosections of HSR with cells not expressing Tspan8 and cells ectopically expressing Tspan8 (left) or cells expressing Tspan8 against the same cells expressing a shRNA against Tspan8 (right). β-actin was used as a loading control in Western blot analysis, where results are representative of two independent experiments. Statistical significance was assessed by two-tailed Student’s t-test or Wilcoxon test, depending on the normality of the paired samples. Mean differences were considered significant when p < 0.05 (* p < 0.05; ** p < 0.01; *** p < 0.001; ns non-significant). The original western blot figures can be found in File S1.

Similar articles

Cited by

References

    1. Shain A.H., Bastian B.C. The Genetic Evolution of Melanoma. N. Engl. J. Med. 2016;374:995–996. doi: 10.1056/NEJMc1515834. - DOI - PubMed
    1. Tirosh I., Izar B., Prakadan S.M., Wadsworth M.H., Treacy D., Trombetta J.J., Rotem A., Rodman C., Lian C., Murphy G., et al. Dissecting the Multicellular Ecosystem of Metastatic Melanoma by Single-Cell RNA-Seq. Science. 2016;352:189–196. doi: 10.1126/science.aad0501. - DOI - PMC - PubMed
    1. Tsoi J., Robert L., Paraiso K., Galvan C., Sheu K.M., Lay J., Wong D.J.L., Atefi M., Shirazi R., Wang X., et al. Multi-Stage Differentiation Defines Melanoma Subtypes with Differential Vulnerability to Drug-Induced Iron-Dependent Oxidative Stress. Cancer Cell. 2018;33:890–904.e5. doi: 10.1016/j.ccell.2018.03.017. - DOI - PMC - PubMed
    1. Hoek K.S., Schlegel N.C., Brafford P., Sucker A., Ugurel S., Kumar R., Weber B.L., Nathanson K.L., Phillips D.J., Herlyn M., et al. Metastatic Potential of Melanomas Defined by Specific Gene Expression Profiles with No BRAF Signature. Pigment. Cell Res. 2006;19:290–302. doi: 10.1111/j.1600-0749.2006.00322.x. - DOI - PubMed
    1. Widmer D.S., Cheng P.F., Eichhoff O.M., Belloni B.C., Zipser M.C., Schlegel N.C., Javelaud D., Mauviel A., Dummer R., Hoek K.S. Systematic Classification of Melanoma Cells by Phenotype-Specific Gene Expression Mapping. Pigment. Cell Melanoma Res. 2012;25:343–353. doi: 10.1111/j.1755-148X.2012.00986.x. - DOI - PubMed

LinkOut - more resources