. 2024 Feb 10;16(4):747.
doi: 10.3390/cancers16040747.

Characterizing the Inflammatory Profile of Neutrophil-Rich Triple-Negative Breast Cancer

Affiliations

Characterizing the Inflammatory Profile of Neutrophil-Rich Triple-Negative Breast Cancer

Fatma Al Qutami et al. Cancers (Basel). .

Abstract

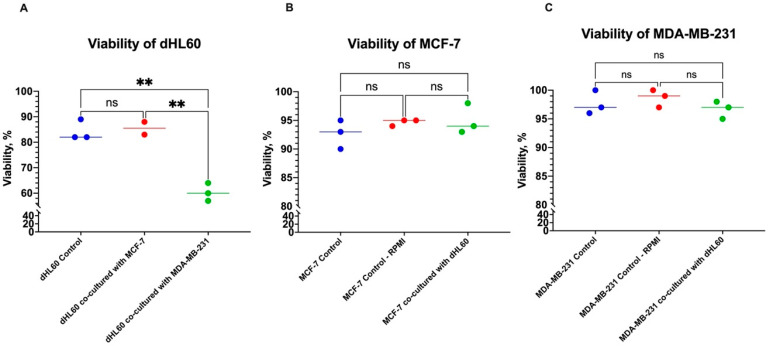
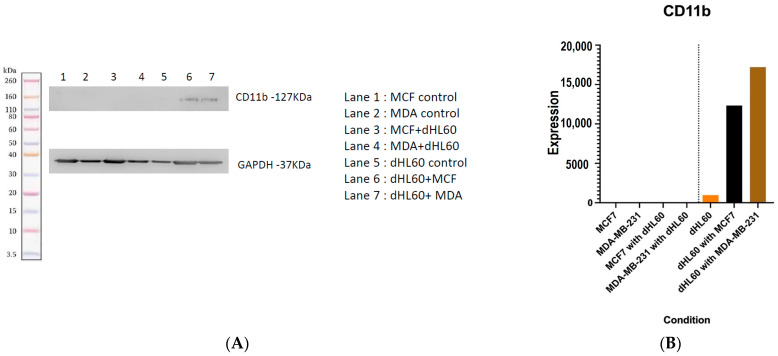
Breast cancer (BC) is one of the most common types of cancer in women in the United Arab Emirates. Immunogenic tumours, such as triple-negative breast cancer (TNBC), show increased neutrophil infiltration, which is associated with poor prognosis and limited efficacy of immunotherapy. This study aims to investigate in vitro the bidirectional effect of neutrophils on metastatic TNBC (MDA-MB-231) compared to less-metastatic luminal breast cancer (MCF-7) cell lines. We found that BC cells or their conditioned medium (CM) reduced the viability of neutrophil-like cells (HL60). This was supported by increased cellular stress and NETosis in differentiated HL60 cells (dHL60) upon exposure to MDA-MB-231 compared to MCF-7-CM using nucleic acid staining essays. Flow cytometry showed comparable expression of inflammatory markers by polymorphonuclear cells (PMN) when treated with MDA-MB-231-CM and standard polarizing cocktails. Furthermore, MDA-MB-231-CM triggered an inflammatory pattern with evidence of stronger adhesion (CD62L) and degranulation (CD11b and CD66b) phenotypes. The proinflammatory polarization of dHL60 by MDA-MB-231-CM was additionally confirmed by the elevated CD54 expression, myeloperoxidase, and CD11b protein levels, which matched an increased transwell migratory capacity. In conclusion, BC might use neutrophils to their benefit through NETosis and complement system activation, which makes this crosstalk a potential mechanism for understanding tumour progression.

Keywords: NETosis; TNBC; neutrophiles; triple-negative breast cancer.


Conflict of interest statement

The authors declare no conflicts of interest.

Figures

Figure 1
Figure 1
HL60 cells differentiation by 6 days in different conditions: (A) HL60 undifferentiated (Control), (B) 1 µM ATRA-treated cells show large, meta-myelocyte morphology, (C) 5 µM ATRA-treated cells show small clumping banded cells, (D) 1.3% DMSO-treated cells show slower differentiation, (E) combination of 1 µM ATRA and 1.3% DMSO caused banded neutrophils to hyper-segmented morphological differentiation, 40× magnification.
Figure 2
Figure 2
The effect of culturing dHL60 or MCF-7 cells in CM on proliferation. (A) The rate of confluence of HL60 was affected by both time and concentration of MCF-7 conditioned media. (B) The migration rate of MCF-7 is different when comparing HL60-CM and dHL60-CM treated groups, with a low concentration of dHL60 (25% CM) eliciting similar effects to a medium concentration (40% CM) of HL60. The statistical significance was calculated using one-way ANOVA and is denoted by the following: **** = p < 0.0001; ** = p < 0.01; * = p < 0.05.
Figure 3
Figure 3
The viability of cells cocultured at seeding for 24 h. (A) There is a viability decrease in dHL60 cocultured with MDA-MB-231 of more than 20% compared to dHL60 controls. However, the dHL60 cell line does not affect the viability of (B) MCF-7 and (C) MDA-MB-231 BC cells. The statistical significance was calculated using one-way ANOVA and is denoted by ** = p < 0.01; ns = insignificant.
Figure 4
Figure 4
The viability of cells cocultured after BC cell lines were left to adhere to the plate for 24 h. (A) The viability of dHL60 decreased in MCF-7, as opposed to MDA-MB-231. There was no effect on the viability of cocultured (B) MCF7 and (C) MDA-MB-231 BC cells; rather, there was a significant increase in viability. The statistical significance was calculated using one-way ANOVA and is denoted by ** = p < 0.01; * = p < 0.05; ns = insignificant.
Figure 5
Figure 5
Comparing the viability of cells between co-culturing at seeding and post adherence of BC. (A) Cocultured dHL60 viability changes were dependent on the tumour type and adherence. (B) MCF-7 and (C) MDA-MB-231 BC cells did not show a change in viability when cocultured with dHL60 at-seeding, yet their viability was improved by coculture post-adherence. The statistical significance was calculated using one-way ANOVA and is denoted by ** = p < 0.01; ns = insignificant.
Figure 6
Figure 6
dHL60 underwent NETosis upon treatment with CM. (A) Fluorescent imaging of dHL60 shows that cells stained for both NucBlue (DNA stain) and SYTOX Green (live/dead DNA stain) are cells undergoing NETosis. Scale bar is 50 μm (B) Percentage of dHL60 cells undergoing NETosis within 30 min of being treated with either LPS or 100% MDA-MB-231 CM.
Figure 7
Figure 7
Flow cytometry shows distinct populations in dHL60 treated with MCF-7 and MDA-MB-231 CM. Expression of Sytox Green and NucBlue show that the majority of cells are NucBlue positive following CM treatment, and MDA-MB-231 has more Sytox Green positive cells compared to MCF-7.
Figure 8
Figure 8
Statistical analysis shows that there was a difference in the stain uptake of duplicate readings. (A) A comparison between each stain in each treatment condition. (B) NucBlue-positive cells were higher in BC-CM-treated dHL60. (C) The MDA-MB-231 CM group had the highest percentage of Sytox Green positive cells; therefore, there were more necrotic and apoptotic cells. (D) MDA-MB-231 CM-treated cells have a higher double–positive ratio compared to MCF-7. The statistical significance was calculated using one-way ANOVA and is denoted by ** = p < 0.01; * = p < 0.05.
Figure 9
Figure 9
Flow cytometric analysis of neutrophils isolated from whole blood and treated with BC CM or polarizing cocktails. (A) frequency of gated populations, N1 and N2 cells show different numbers of cells between MDA-MB-231 and N1 polarized cells compared to other cells. (B) The dot plot shows shifting populations based on CD182 expression. (C) Statistical analysis shows a significant difference in CD182+ and CD182- populations in MDA-MB-231 CM and N1 polarized cells. (D) CD182- population was mostly in N0 state, with MDA-MB-231 having a higher N1 population. (E) CD182+ population was mostly in the N2 state with no differences between conditions. (F) N2 cells are activated differently between conditions, with (G) statistical analysis showing MDA-MB-231 and N1-polarized cells having the highest level of N2 activation. (H) From the activated N2 population, most are degranulating, with (I) the MDA-MB-231 and N1-polarized cell exhibiting similar degranulation as N2-polarized cells. The statistical significance was calculated using one-way ANOVA and is denoted by ****= p < 0.0001; *** = p < 0.001; ** = p < 0.01; * = p < 0.05.
Figure 9
Figure 9
Flow cytometric analysis of neutrophils isolated from whole blood and treated with BC CM or polarizing cocktails. (A) frequency of gated populations, N1 and N2 cells show different numbers of cells between MDA-MB-231 and N1 polarized cells compared to other cells. (B) The dot plot shows shifting populations based on CD182 expression. (C) Statistical analysis shows a significant difference in CD182+ and CD182- populations in MDA-MB-231 CM and N1 polarized cells. (D) CD182- population was mostly in N0 state, with MDA-MB-231 having a higher N1 population. (E) CD182+ population was mostly in the N2 state with no differences between conditions. (F) N2 cells are activated differently between conditions, with (G) statistical analysis showing MDA-MB-231 and N1-polarized cells having the highest level of N2 activation. (H) From the activated N2 population, most are degranulating, with (I) the MDA-MB-231 and N1-polarized cell exhibiting similar degranulation as N2-polarized cells. The statistical significance was calculated using one-way ANOVA and is denoted by ****= p < 0.0001; *** = p < 0.001; ** = p < 0.01; * = p < 0.05.
Figure 10
Figure 10
Frequency for each marker in the CD15+ population. Both N1 and MDA-MB-231 CM seem to exhibit similar inflammatory patterns on PMNs as opposed to other conditions. Blue = RPMI control, Red = N2, Orange = N1, Green = MDA-MB-231, Cyan = MCF7, Purple = DMEM control.
Figure 11
Figure 11
Heatmap of the frequency of the markers in PMNs.
Figure 12
Figure 12
MDA-MB-231 CM increases myeloperoxidase concentration in the media. (A) concentration of MPO in the supernatant after 30 min and 4 h of stimulation with BC CM. (B) Percentage increase in MPO levels after 4 h of treatment compared to controls. (C) Comparing the percentage increase in MPO levels between 30 min and 4 h shows that N1 and N2 polarization cocktails had increased concentration by more than 100% between 30 min and 4 h. The statistical significance was calculated using one-way ANOVA and t-test and is denoted by ** = p < 0.01.
Figure 13
Figure 13
Neutrophil elastase in the microenvironment is not affected by BC CM. (A) The concentration of NE in the supernatant after 30 min and 4 h of stimulation with BC CM or polarizing cocktails. (B) Comparing the percentage increase in NE levels between 30 min and 4 h shows that MCF-7 had slightly elevated NE levels in the medium. The statistical significance was calculated using t-test and is denoted by * = p < 0.05.
Figure 14
Figure 14
The differential effects of CM on different polarizing agents affecting the MPO and NE levels in the supernatant. (A) MPO was increased in the presence of CM, while (B) NE showed a different pattern with the most significant change with C-GSF. The statistical significance was calculated using t-test and is denoted by * = p < 0.05.
Figure 15
Figure 15
MDA-MB-231 CM increased CD54 (ICAM-1) expression on dHL60. (A) Flow cytometry dot plots show the percentage of cells having CD54 high expression. (B) Bar plot shows CD54 expression on neutrophil-like cell line HL60 followed by different treatments with BC CM with/without 100 ng/mL LPS stimulation. (C) Histogram plots show the expression of ICAM-1 with different treatments. The statistical significance was calculated using one-way ANOVA and is denoted by ** = p < 0.01; * = p < 0.05.
Figure 16
Figure 16
The ratio of cells that have migrated to the lower chamber in dHL60 trans-well migration assay in response to IL8 or BC CM. (A) Comparing the cell ratio to that of DMEM control, and (B) comparing the cell ratio to the positive control, IL8. The statistical significance was calculated using one way ANOVA and t test and is denoted by the following: ** = p < 0.01.
Figure 17
Figure 17
The ratio of cells that have not migrated and remain in the upper chamber in dHL60 trans-well migration assay in response to IL8 or BC CM. (A) Comparing the cell ratio to that of DMEM control, and (B) comparing the cell ratio to the positive control, IL8. The statistical significance was calculated using one-way ANOVA and t test and is detonated by the following: * = p < 0.05, ns = not significant.
Figure 18
Figure 18
The ratio of cells that remained in the trans-well chamber in dHL60 trans-well migration assay in response to IL8 or BC CM. The ratio of dHL60 cells remaining in the trans well membrane compared to controls. The statistical significance was calculated using one way ANOVA and t test and is detonated by the following: *** = p < 0.001; ** = p < 0.01.
Figure 19
Figure 19
Western blot of CD11b with GAPDH used as a housekeeping protein. (A) CD11b bands appear around 127 kDa, being the most significantly expressed protein. The uncropped blots are shown in the supplementary materials. (B) ImageJ software (ImageJ v1.53) quantification of the protein shows that BC cell lines increased the expression of CD11b by dHL60 cells.

References

    1. Al-Shamsi H.O., Abdelwahed N., Al-Awadhi A., Albashir M., Abyad A.M., Rafii S., Afrit M., Lababidi B.A., Abu-Gheida I., Sonawane Y.P., et al. Breast Cancer in the United Arab Emirates. JCO Glob. Oncol. 2023;9:e2200247. doi: 10.1200/GO.22.00247. - DOI - PMC - PubMed
    1. Elobaid Y., Aamir M., Grivna M., Suliman A., Attoub S., Mousa H., Ahmed L.A., Oulhaj A. Breast cancer survival and its prognostic factors in the United Arab Emirates: A retrospective study. PLoS ONE. 2021;16:e0251118. doi: 10.1371/journal.pone.0251118. - DOI - PMC - PubMed
    1. Ribeiro R., Carvalho M.J., Goncalves J., Moreira J.N. Immunotherapy in triple-negative breast cancer: Insights into tumor immune landscape and therapeutic opportunities. Front. Mol. Biosci. 2022;9:903065. doi: 10.3389/fmolb.2022.903065. - DOI - PMC - PubMed
    1. Debien V., De Caluwé A., Wang X., Piccart-Gebhart M., Tuohy V.K., Romano E., Buisseret L. Immunotherapy in breast cancer: An overview of current strategies and perspectives. NPJ Breast Cancer. 2023;9:7. doi: 10.1038/s41523-023-00508-3. - DOI - PMC - PubMed
    1. Mir H., Singh S. Neutrophils: A roadblock for immunotherapy. Nat. Rev. Cancer. 2022;22:378–379. doi: 10.1038/s41568-022-00464-3. - DOI - PubMed