

Are Artificial Intelligence-Assisted Three-Dimensional Histological Reconstructions Reliable for the Assessment of Trabecular Microarchitecture?
- PMID: 38398417
- PMCID: PMC10889719
- DOI: 10.3390/jcm13041106
Are Artificial Intelligence-Assisted Three-Dimensional Histological Reconstructions Reliable for the Assessment of Trabecular Microarchitecture?
Abstract
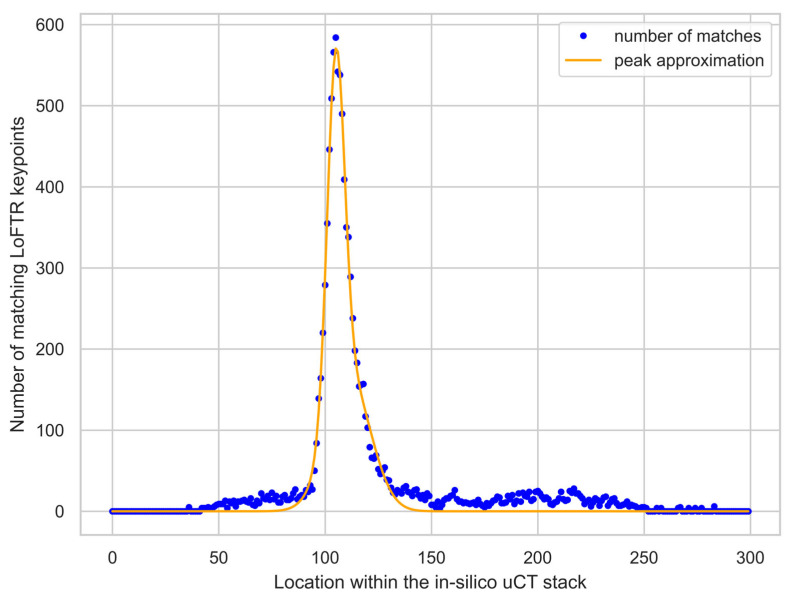
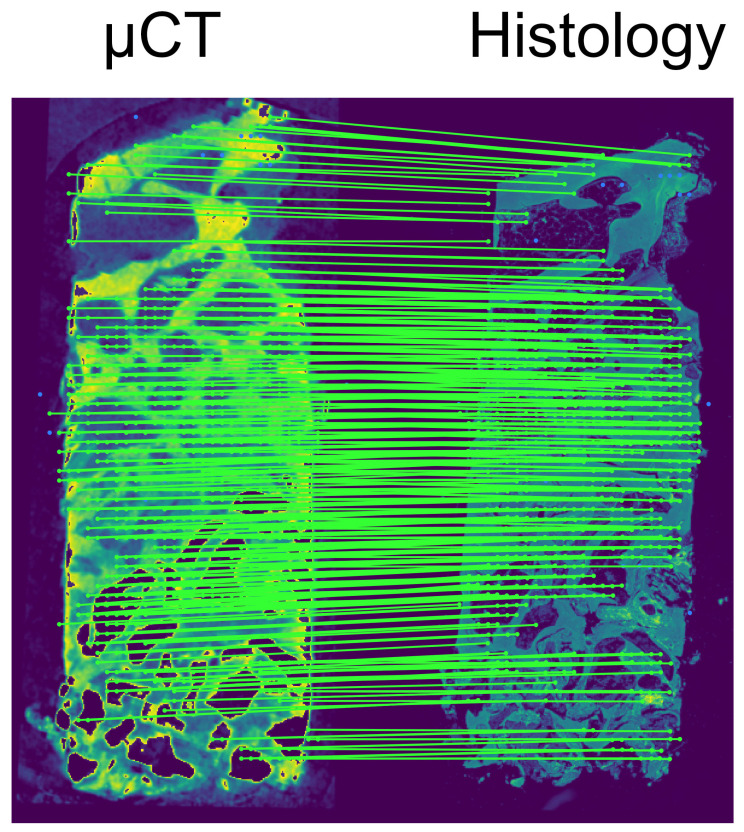
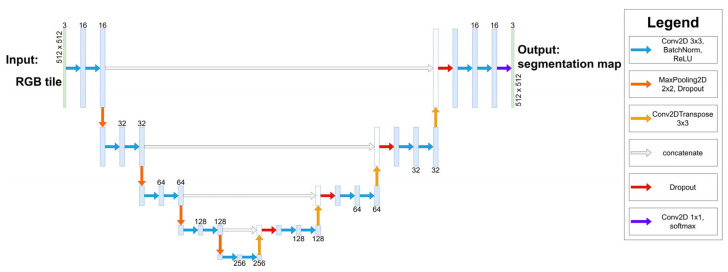
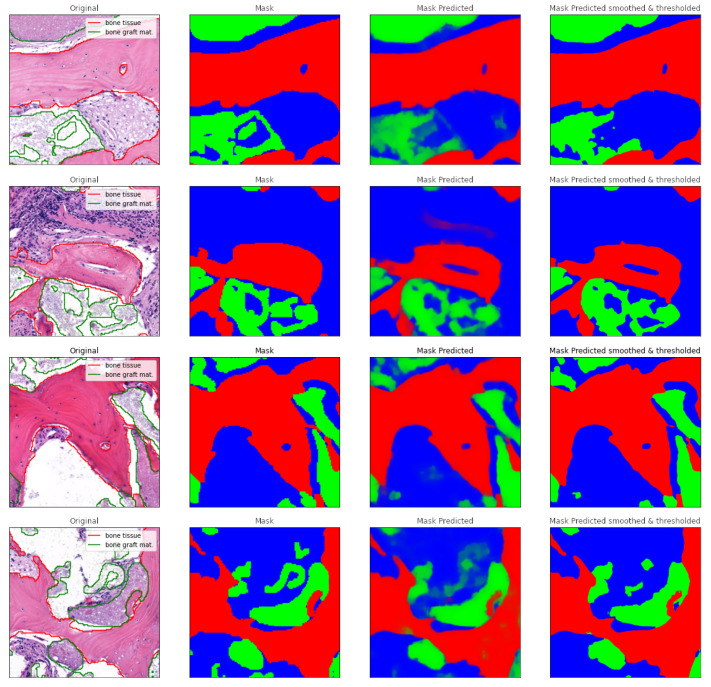
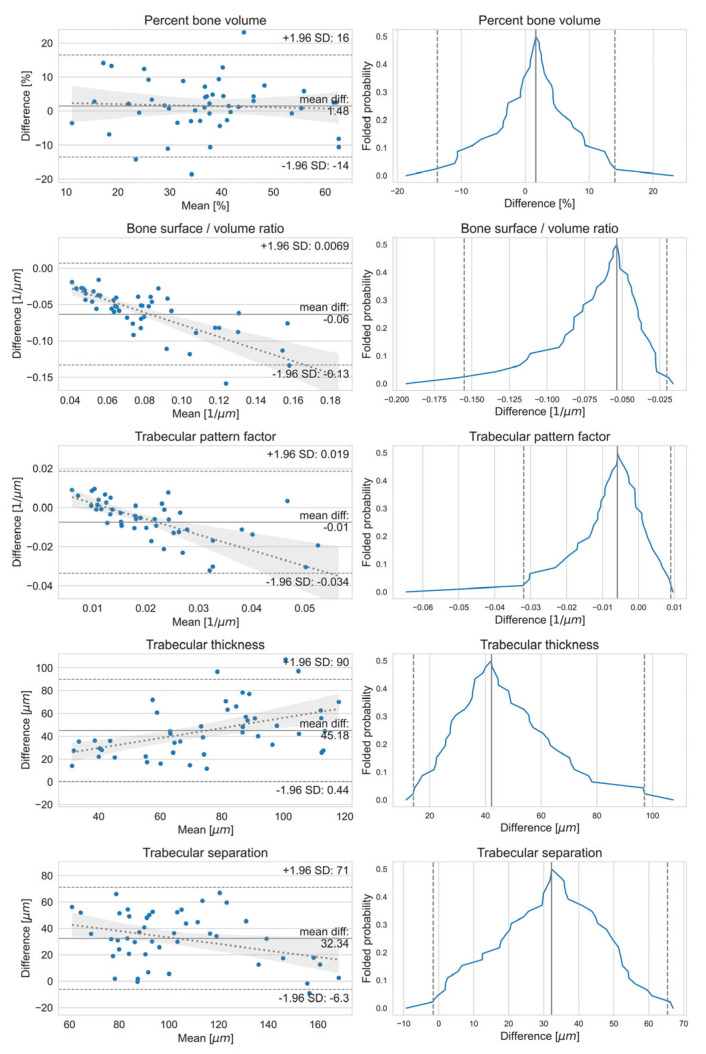
Objectives: This study aimed to create a three-dimensional histological reconstruction through the AI-assisted classification of tissues and the alignment of serial sections. The secondary aim was to evaluate if the novel technique for histological reconstruction accurately replicated the trabecular microarchitecture of bone. This was performed by conducting micromorphometric measurements on the reconstruction and comparing the results obtained with those of microCT reconstructions. Methods: A bone biopsy sample was harvested upon re-entry following sinus floor augmentation. Following microCT scanning and histological processing, a modified version of the U-Net architecture was trained to categorize tissues on the sections. Detector-free local feature matching with transformers was used to create the histological reconstruction. The micromorphometric parameters were calculated using Bruker's CTAn software (version 1.18.8.0, Bruker, Kontich, Belgium) for both histological and microCT datasets. Results: Correlation coefficients calculated between the micromorphometric parameters measured on the microCT and histological reconstruction suggest a strong linear relationship between the two with p-values of 0.777, 0.717, 0.705, 0.666, and 0.687 for BV/TV, BS/TV, Tb.Pf Tb.Th, and Tb.Sp, respectively. Bland-Altman and mountain plots suggest good agreement between BV/TV measurements on the two reconstruction methods. Conclusions: This novel method for three-dimensional histological reconstruction provides researchers with a tool that enables the assessment of accurate trabecular microarchitecture and histological information simultaneously.
Keywords: artificial intelligence (AI); bone augmentation; dental implant; histomorphometry; microCT; three-dimensional histological reconstruction.
Conflict of interest statement
J.B., D.P., E.K., A.P., M.S., O.N., P.P. and M.K. have a patent registered for the Method for Digital Imaging of Three-Dimensional Tissue Structures from a Bone Biopsy Sample at the Hungarian Intellectual Property Office, P2200152. The remaining authors have no conflicts of interest to declare.
Figures
Similar articles
-
Reconstructing 3D histological structures using machine learning (artificial intelligence) algorithms.Pathologie (Heidelb). 2024 Nov;45(Suppl 1):67-73. doi: 10.1007/s00292-024-01387-6. Epub 2024 Nov 21. Pathologie (Heidelb). 2024. PMID: 39570395 Review. English.
-
Agreement between Histomorphometry and Microcomputed Tomography to Assess Bone Microarchitecture of Dental Implant Sites.Clin Implant Dent Relat Res. 2015 Aug;17(4):732-41. doi: 10.1111/cid.12176. Epub 2013 Nov 17. Clin Implant Dent Relat Res. 2015. PMID: 24238279
-
Comparison insight bone measurements by histomorphometry and microCT.J Bone Miner Res. 2005 Jul;20(7):1177-84. doi: 10.1359/JBMR.050205. Epub 2005 Feb 14. J Bone Miner Res. 2005. PMID: 15940370
-
Comparison of synchrotron radiation and conventional x-ray microcomputed tomography for assessing trabecular bone microarchitecture of human femoral heads.Med Phys. 2006 Sep;33(9):3568-77. doi: 10.1118/1.2256069. Med Phys. 2006. PMID: 17022253
-
Micro-tomographic imaging for the nondestructive evaluation of trabecular bone architecture.Stud Health Technol Inform. 1997;40:61-79. Stud Health Technol Inform. 1997. PMID: 10168883 Review.
References
-
- Friberg B., Jemt T., Lekholm U. Early failures in 4,641 consecutively placed brånemark dental implants: A study from stage 1 surgery to the connection of completed prostheses. Int. J. Oral. Maxillofac. Implant. 1991;6:142–146. - PubMed
Grants and funding
LinkOut - more resources
Full Text Sources
