. 2024 Feb 7;29(4):760.
doi: 10.3390/molecules29040760.

Chlorogenic Acid Attenuates Isoproterenol Hydrochloride-Induced Cardiac Hypertrophy in AC16 Cells by Inhibiting the Wnt/β-Catenin Signaling Pathway

Affiliations

Chlorogenic Acid Attenuates Isoproterenol Hydrochloride-Induced Cardiac Hypertrophy in AC16 Cells by Inhibiting the Wnt/β-Catenin Signaling Pathway

Kai He et al. Molecules. .

Abstract

Cardiac hypertrophy (CH) is an important characteristic in heart failure development. Chlorogenic acid (CGA), a crucial bioactive compound from honeysuckle, is reported to protect against CH. However, its underlying mechanism of action remains incompletely elucidated. Therefore, this study aimed to explore the mechanism underlying the protective effect of CGA on CH. This study established a CH model by stimulating AC16 cells with isoproterenol (Iso). The observed significant decrease in cell surface area, evaluated through fluorescence staining, along with the downregulation of CH-related markers, including atrial natriuretic peptide (ANP), brain natriuretic peptide (BNP), and β-myosin heavy chain (β-MHC) at both mRNA and protein levels, provide compelling evidence of the protective effect of CGA against isoproterenol-induced CH. Mechanistically, CGA induced the expression of glycogen synthase kinase 3β (GSK-3β) while concurrently attenuating the expression of the core protein β-catenin in the Wnt/β-catenin signaling pathway. Furthermore, the experiment utilized the Wnt signaling activator IM-12 to observe its ability to modulate the impact of CGA pretreatment on the development of CH. Using the Gene Expression Omnibus (GEO) database combined with online platforms and tools, this study identified Wnt-related genes influenced by CGA in hypertrophic cardiomyopathy (HCM) and further validated the correlation between CGA and the Wnt/β-catenin signaling pathway in CH. This result provides new insights into the molecular mechanisms underlying the protective effect of CGA against CH, indicating CGA as a promising candidate for the prevention and treatment of heart diseases.

Keywords: Wnt/β-catenin; cardiac hypertrophy; chlorogenic acid.


Conflict of interest statement

The authors declare that they have no competing interests.

Figures

Figure 1
Figure 1
Effects of CGA on the viability of AC16 cells. (A) The optical density values of AC16 cells changed with increasing CGA concentrations. (B) Viability of AC16 cells treated with different concentrations of CGA. The survival rate of AC16 cells in the NC group was set to 100, and the data in the line graph represent cell viability after the different treatments as a percentage of that of the NC group. Data are the mean ± SD. ns p > 0.05 compared to the NC group. NC, negative control; CGA, chlorogenic acid.
Figure 2
Figure 2
Effect of CGA on the surface area of AC16 cells. (A) Changes in the size of AC16 cells were captured after treatment with different concentrations of CGA or/and Iso (10 µM). (B) The area of AC16 cells was quantified using ImageJ software (version 1.83). ### p< 0.001 vs. NC group, ns p > 0.05, * p < 0.05, ** p < 0.01, *** p < 0.001 vs. the Iso group. NC, negative control; CGA, chlorogenic acid; Iso, isoproterenol.
Figure 3
Figure 3
Effects of CGA on the transcriptional expression of ANP, BNP, and β-MHC in AC16 cells. (AC) mRNA expression of the hypertrophy molecular markers ANP (A), BNP (B), and β-MHC (C), determined by qPCR. Data are presented as mean ± standard deviation. ### p < 0.001 compared to the NC group, ns p > 0.05, ** p < 0.01, *** p < 0.001 compared to the Iso group.
Figure 4
Figure 4
Effect of CGA on the protein expression levels of ANP and BNP in AC16 cells. (A) Protein expression of ANP and BNP was measured by WB and statistically analyzed (B,C). Data are presented as mean ± SD. ### p < 0.001 vs. the NC group, ns p > 0.05, * p < 0.05, ** p < 0.01, *** p < 0.001 vs. the Iso group. NC, negative control; CGA, chlorogenic acid; Iso, isoproterenol; ANP, atrial natriuretic peptide; BNP, brain natriuretic peptide.
Figure 5
Figure 5
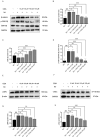
Effect of CGA on the Wnt/β-catenin signaling pathway. (A,E,F) Changes in the protein levels of Wnt/β-catenin signaling pathway markers, including β-catenin, GSK-3β, p-GSK-3β/GSK-3β, LRP6, and c-Myc, were detected by Western blotting in AC16 cells pretreated with various concentrations of CGA or/and Iso (10 μM). (BD,G,H) Changes in β-catenin, GSK-3β, p-GSK-3β/GSK-3β, LRP6, and c-Myc expression quantified by ImageJ software (version 1.83). Data are presented as mean ± SD. # p < 0.05, ### p < 0.001 vs. control group, ns p > 0.05, * p < 0.05, ** p < 0.01, *** p < 0.001 vs. Iso group. NC, negative control; CGA, chlorogenic acid; Iso, isoproterenol; LRP6, low-density lipoprotein receptor-related protein 6; p-, phosphorylated; GSK3β, glycogen synthase kinase 3β.
Figure 6
Figure 6
Effect of CGA and IM-12 on the expression of proteins in the Wnt signaling pathway. (A,D,G,I) Changes in the protein levels of Wnt/β-catenin signaling pathway markers, including LRP6, β-catenin, GSK-3β, p-GSK-3β/GSK-3β, c-Myc, ANP, and BNP. (B,C,E,F,H,IK) Changes in LRP6, β-catenin, GSK-3β, p-GSK-3β/GSK-3β, c-Myc, ANP, and BNP expression quantified by ImageJ sofware (version 1.83). Data are presented as mean ± SD. ## p < 0.01, ### p < 0.001 vs. the NC group, ns p > 0.05, * p < 0.05, ** p < 0.01, *** p < 0.001 vs. Iso group/vs. control group. NC, negative control; CGA, chlorogenic acid; Iso, isoproterenol; LRP6, low-density lipoprotein receptor-related protein 6; p-, phosphorylated; GSK3β, glycogen synthase kinase 3β; ANP, atrial natriuretic peptide; BNP, brain natriuretic peptide.
Figure 7
Figure 7
Identification of differentially expressed genes (DEGs) in HCM tissue. (A) Volcano plots of DEGs in HCM tissue. (B) Heatmaps of the top 30 DEGs in HCM tissue. Red, up-regulated DEGs; blue, down-regulated DEGs.
Figure 8
Figure 8
Identification of modules correlated with HCM in transcriptome datasets. (A) The purpose of the analysis was to evaluate the independence of scale and the average connectivity for the best soft-thresholding powers in the HCM dataset. (B) The samples in the HCM dataset were used to construct hierarchical clustering dendrograms. (C) Diagrams illustrating the relationship between modules and traits were also created for the HCM dataset, where each row represents a color module, and each column represents a clinical trait. The correlation and p-value for each combination of module and trait are shown in the corresponding cells.
Figure 9
Figure 9
Functional enrichment analysis of Wnt signaling pathway-related targets of CGA in HCM-affected cells. (A) Volcano plots of DEGs associated with CGA. (B) Venn diagram analysis of the targets of CGA in HCM-affected cells involving the Wnt signaling pathway. (C) The top 10 enriched functional terms for 17 intersecting targets.

Similar articles

Cited by

References

    1. Catapano A.L., Daccord M., Damato E., Humphries S.E., Neely R.D.G., Nordestgaard B.G., Pistollato M., Steinhagen-Thiessen E. How should public health recommendations address Lp(a) measurement, a causative risk factor for cardiovascular disease (CVD)? Atherosclerosis. 2022;349:136–143. doi: 10.1016/j.atherosclerosis.2022.02.013. - DOI - PubMed
    1. Harikrishnan S., Jeemon P., Mini G.K., Thankappan K.R., Sylaja P.G.B.D. Global, regional, and national age-sex-specific mortality for 282 causes of death in 195 countries and territories, 1980–2017: A systematic analysis for the Global Burden of Disease Study 2017. Lancet. 2018;392:1736–1788. doi: 10.1016/s0140-6736(18)32203-7. - DOI - PMC - PubMed
    1. Levy D., Garrison R.J., Savage D.D., Kannel W.B., Castelli W.P. Prognostic implications of echocardiographically determined left ventricular mass in the Framingham Heart Study. N. Engl. J. Med. 1990;322:1561–1566. doi: 10.1056/NEJM199005313222203. - DOI - PubMed
    1. Hunter J.J., Chien K.R. Signaling pathways for cardiac hypertrophy and failure. N. Engl. J. Med. 1999;341:1276–1283. doi: 10.1056/NEJM199910213411706. - DOI - PubMed
    1. Barry S., Townsend P. What causes a broken heart--molecular insights into heart failure. Int. Rev. Cell Mol. Biol. 2010;284:113–179. doi: 10.1016/s1937-6448(10)84003-1. - DOI - PubMed

MeSH terms