. 2024 Feb 3;16(2):246.
doi: 10.3390/v16020246.

Prior Influenza Infection Mitigates SARS-CoV-2 Disease in Syrian Hamsters

Affiliations

Prior Influenza Infection Mitigates SARS-CoV-2 Disease in Syrian Hamsters

Caterina Di Pietro et al. Viruses. .

Abstract

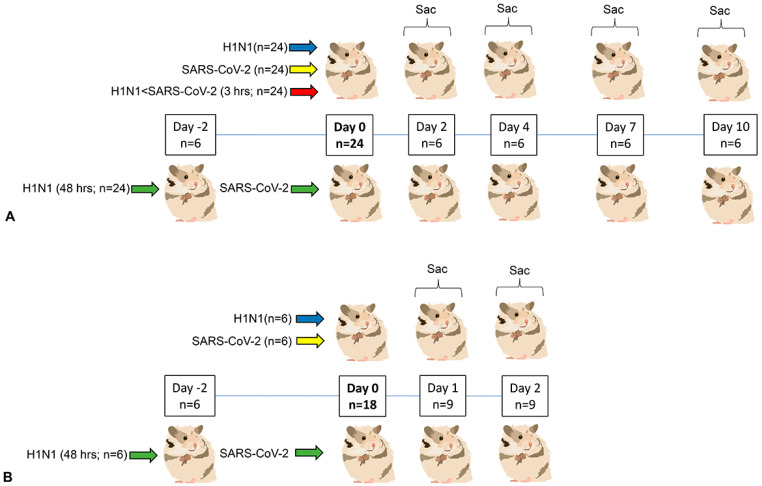
Seasonal infection rates of individual viruses are influenced by synergistic or inhibitory interactions between coincident viruses. Endemic patterns of SARS-CoV-2 and influenza infection overlap seasonally in the Northern hemisphere and may be similarly influenced. We explored the immunopathologic basis of SARS-CoV-2 and influenza A (H1N1pdm09) interactions in Syrian hamsters. H1N1 given 48 h prior to SARS-CoV-2 profoundly mitigated weight loss and lung pathology compared to SARS-CoV-2 infection alone. This was accompanied by the normalization of granulocyte dynamics and accelerated antigen-presenting populations in bronchoalveolar lavage and blood. Using nasal transcriptomics, we identified a rapid upregulation of innate and antiviral pathways induced by H1N1 by the time of SARS-CoV-2 inoculation in 48 h dual-infected animals. The animals that were infected with both viruses also showed a notable and temporary downregulation of mitochondrial and viral replication pathways. Quantitative RT-PCR confirmed a decrease in the SARS-CoV-2 viral load and lower cytokine levels in the lungs of animals infected with both viruses throughout the course of the disease. Our data confirm that H1N1 infection induces rapid and transient gene expression that is associated with the mitigation of SARS-CoV-2 pulmonary disease. These protective responses are likely to begin in the upper respiratory tract shortly after infection. On a population level, interaction between these two viruses may influence their relative seasonal infection rates.

Keywords: SARS-CoV-2; hamster; influenza; interference; transcriptomics.


Conflict of interest statement

The authors declare no conflicts of interest.

Figures

Figure 1
Figure 1
Study design. (A) Experiment 1. Four infection groups (24 animal per infection type, split evenly by sex) were studied. Two groups were inoculated intranasally on Day 0 with 106 PFU/animal of either H1N1 (blue) or SARS2 (yellow). In coinfected groups, animals were given H1N1 first, followed by SARS-CoV-2 given either 3 h (red) or 48 h (green) later. Identical doses and volumes were used for each virus in coinfections. Six animals were sacrificed at 2, 4, 7 and 10 days post-Day 0. A 24-animal control cohort was aggregated from 4 to 6 animals accompanying each infection group. Control animals were mock inoculated with media and sacrificed on similar days. (B) Experiment 2: Three infection groups (6 animals per infection type, male) were studied. Two groups were inoculated intranasally on Day 0 with 106 PFU/animal of either H1N1 (blue) or SARS2 (yellow). Only one coinfection group (H1N1 followed by SARS-CoV-2 given 48 h later) was used. Half of the animals in each infection group were sacrificed 24 h post Day 0, and the remainder sacrificed 24 h later. Four media-only inoculated animals (male) sacrificed on similar days provided controls.
Figure 2
Figure 2
Body weight change and respiratory rate by infection group. (A,B): Body weight change in males (A) and females (B). Mock-inoculated control animals (grey) of both sexes gain weight over 10 days. This pattern was replicated in both sexes given H1N1 (blue), and in the H1N1-SARS-CoV-2 48 h coinfection (green), although the rate of weight gain was slower in males than in females. In SARS-CoV-2-only infected animals (orange), both sexes lost weight, however females regained weight faster. With H1N1-SARS-CoV-2 3 h coinfection (red), weight loss in both sexes approximated that seen in SARS-CoV-2-only infection but recovered by 4–5 dpi. Weight gain in females accelerated to approximate that seen in control females whereas males recover at a slower rate. (C,D): Respiratory rate in males (C) and females (D). Respiratory rates remain constant in control (grey) and H1N1 infected (blue) males and females. In SARS-CoV-2-only and H1N1/SARS-CoV-2 coinfection groups, respiratory rates become elevated by 4–5 dpi, with resolution by 8 dpi in all groups. Males experience higher respiratory rates during this period than females. BW = body weight; bpm = breaths per minute. p-values for comparisons across infection type and sex are given in Tables S4 and S5.
Figure 3
Figure 3
Comparative histopathology of H1N1 only, SARS-CoV-22 only and H1N1/SARS-CoV-2 coinfection groups (A) Representative subgross histology, left lung, 2–10 dpi, males only. Mild, rather diffuse interstitial pneumonia (arrows) is evident in H1N1 only infected hamsters from 2–7 dpi. In the SARS-CoV-2 only group, well-defined nodular broncho-interstitial pneumonia reaches its nadir at 7 dpi (black arrows) with partial resolution at 10 dpi. Intervening parenchyma is normal. In the 3 h coinfected group, nodular inflammation (black arrows) with intervening alveolar congestion and mild interstitial inflammation resulting from H1N1 infection (red arrow) is evident. In 48 h coinfected animals, inflammation appears by 2 dpi in some animals (black arrow), but nodular broncho-interstitial pneumonia is less severe throughout disease course. Bar = 500 µm. (B–D): H1N1 only infection, 4 dpi, male. Interstitial congestion with mild alveolar consolidation (B) is present. Parenchymal consolidation is minimal, and Inflammation dominated by intra-alveolar macrophages (C), with few neutrophils (arrow, D). (E–G): SARS-CoV-2-only infection, 7 dpi, male. Dense interstitial infiltration (asterisk, E) characterizes well-defined nodular inflammation. Infiltrating cells are macrophage dominant (asterisk, F) with fewer neutrophils (arrows, G). (H–J): H1N1 < SARS-CoV-2 3 h coinfection, 7 dpi, male. Interstitial and alveolar infiltration (H) by macrophage dominant inflammation (I) and scattered neutrophils (arrows, J) is present. (K–M): H1N1 < SARS-CoV-2 48 h coinfection, 7 dpi, male. Nodular lesions are less severe than in SARS2 only infection, with reduced interstitial consolidation (K) and predominant intra-alveolar macrophage (L) infiltration. Neutrophils are difficult to detect (M). Haematoxylin and eosin (A,B,E,H,K) Aif-1 immunohistochemistry (C,F,I,L) Bar = 500 µm (A), 20 µm (B,C,E,F,H,I,K,L); 10 µm (D,G,J,M).
Figure 4
Figure 4
Total histopathology score and viral immunohistochemistry in single and dual-infected hamsters. (A) Total histopathology score, H1N1 only, SARS-CoV-2 only and dual coinfection groups. Early onset airway pathology results in higher scores for H1N1 infected animals (blue) at 2 dpi. SARS-CoV-2 associated pathology (yellow) develops more slowly but is more severe with a nadir at 7 dpi. This pattern is exacerbated in the 3 h coinfection group (red) and mitigated in the 48 h coinfection group (green). Sexes are combined. * p < 0.05, ** p < 0.01, *** p < 0.001. Methods for assessing total histopathology score are given in Table S1. (B) Pulmonary SARS-CoV-2 NP immunohistochemistry, single and dual SARS2 infected groups. SARS-CoV-2 NP is evident in bronchiolar epithelium at 2 dpi (arrows), with the highest levels detected in parenchyma at 4 dpi (arrows), prior to the nadir of pulmonary inflammation at 7 dpi in all groups. SARS-CoV-2 NP immunostaining is reduced in the 48 h coinfection group and persists in single cells in the 3 h coinfection group (arrows). (C,D) Respiratory epithelium, maxillary sinus, dual 3 h coinfection, 4 dpi, male. H1N1 is detected in cilia, apical aspects and within discrete intracellular structures consistent with lysosomes (red arrows). SARS-CoV-2 NP is diffusely distributed through the cytoplasm (green arrows). (E) Intra-alveolar macrophages, dual 3 h coinfection, 4 dpi, male. Detection of H1N1 concentrated near cytoplasmic membrane (red arrow) and SARS-CoV-2 NP seen throughout cytoplasm (green arrow) in coinfected intra-alveolar macrophages. (F) Bronchiolar epithelium, H1N1 < SARS-CoV-2 3 h coinfection, 4 dpi, male. Apical expression of H1N1 is evident in bronchiolar epithelium (red arrows). SARS-CoV-2 NP is diffusely distributed through the cytoplasm (green arrows). (G) Alveolar epithelium, dual 3 h coinfection, 4 dpi, male. Although SARS-CoV-2 NP immunostaining (green) is more widespread than H1N1 immunostaining (red) in alveolar epithelium, colocalization can be seen in some areas (red and green arrow). Bar = 10 µm (B): SARS-CoV-2 immunohistochemistry, light microscopy. Bar =100 µm (all panels) (C–G): SARS-CoV-2 and H1N1 immunohistochemistry, confocal microscopy. Bar = 20 µm (E); 5 µm (F,G).
Figure 5
Figure 5
Flow cytometry of myeloid cell populations in bronchoalveolar lavage fluid and blood of infected hamsters at 2, 4, 7 and 10 dpi and the uninfected controls. The cell subsets were defined and gated as described in Methods and Figure S1 and the frequencies expressed as a percentage of all viable leukocytes: A, B: Granulocytes in BALF (A) and peripheral blood (B). C-H: Subsets of non-granulocytic myeloid cells distinguished by their varied expression of Aif1 and IEk; Aif + IEk- myeloid cells in BALF (C) and peripheral blood (D); Aif+ IEk+ cells in BALF (E) and peripheral blood (F); Aif- IEk+ myeloid cells in BALF (G) and peripheral blood (H). Individual values for each animal and means are presented. Numbers of animals for BAL analyses: n = 23 (Control); n = 23 (H1N1); n = 10 (SARS-CoV-2); n = 23 (Dual-3 h); n = 23 (Dual-48 h); for blood analyses n = 23 (Control); n = 24 (H1N1); n = 19 (SARS-CoV-2); n = 24 (Dual-3 h); n = 23 (Dual-48 h). Sexes are combined for statistical analysis. * p < 0.05, ** p < 0.01, *** p < 0.001. Asterisks and bars are colored as follows. Blue (H1N1/Control); Yellow (SARS-CoV-2/Control); Red (Dual-3 h/SARS-CoV-2); Green (Dual-48 h/SARS-CoV-2). See Table S4 for values.
Figure 6
Figure 6
Differentially expressed genes (DEGs) in nasal epithelial gene expression at day 1 and 2 post-inoculation (H1N1, SARS-CoV-2 single infections, and 48 h H1N1/SARS-CoV-2 dual infection). (A) Violin plot illustrating expression levels (Log2Fold Change) of DEGS (padj < 0.05) in each infection group (n = 3 males per infection type and day after infection, noted as 1 or 2 on X axis), compared to the same control group (mock inoculated males, n = 4). Mean (standard deviation) for each group given above its violin plot; total number of DEGs for each group (Blue: H1N1, Yellow: SARS-CoV-2; Green: Dual infection) is given below. Significance of mean gene expression between pairs of infection groups was assessed with a t-test, with a Bonferroni correction (0.05/3 comparisons =0.0166). **** (p < 0.0001), * (p < 0.05), NS = not significant. (B) Violin plot illustrating expression levels (Log2Fold Change) of DEGS shown in A, filtered by an additional condition (differentially expressed in at least three of the six infection groups with a padj < 0.001). Mean (standard deviation) for each group (Blue: H1N1, Yellow: SARS-CoV-2; Green: Dual infection) given above its violin plot. The full list of genes (n = 246 genes) is given in Supplementary Data S2. Significance of mean gene expression between pairs of infection groups was assessed with a t-test, with a Bonferroni correction (0.05/3 comparisons =0.0166). **** (p < 0.0001), * (p < 0.05), NS = not significant. (C) Bubble graph illustrating REACTOME pathway analysis of significantly differentially expressed genes (n = 158, padj > 0.05) at day 2 in H1N1 (blue) singly infected hamsters, within the 246 gene subset of DEGS shown in B. Pathways engaged with an Entities pVal < 0.05 are illustrated, with the number of genes within each pathway given to the right of each bubble. Of 158 genes used for analysis, 34 failed to map to human homologues. (D) Bubble graph illustrating REACTOME pathway analysis of significantly differentially expressed genes (padj > 0.05) at day 1 in H1N1 < SARS-CoV-2 dual-infected hamsters compared to SARS-CoV-2 singly infected hamsters. Pathways engaged with an Entities pVal < 0.05 are illustrated, with the number of genes within each pathway given to the right of each bubble. Underexpressed pathways are colored green, overexpressed pathways colored red. Of 1130 genes used in REACTOME analysis, 374 did not map to human homologues.
Figure 7
Figure 7
Viral gene expression (nasal and lung) and cytokine expression (lung) in H1N1, SARS-CoV-2 singly infected, and 48 h dual-infected groups at the dpi indicated. (A) H1N1 M gene expression in nasal and lung tissue in H1N1 and dual-infected groups. (B) SARS-CoV-2 RdRp expression in nasal and lung tissue in SARS-CoV-2 and dual-infected groups. (C) Selected lung cytokine expression in H1N1, SARS-CoV-2 singly infected, and 48 h dual-infected groups. Columns associated with significant comparisons are outlined in black. Expression of some cytokines (TNF-α, IFN-α, Ace-2, Ccl-8) are not illustrated, however full viral and cytokine expression data are given in Table S4. qRT-PCR, * p < 0.05, ** p < 0.01, *** p < 0.001.

Similar articles

Cited by

References

    1. Tokars J.I., Olsen S.J., Reed C. Seasonal Incidence of Symptomatic Influenza in the United States. Clin. Infect. Dis. 2018;66:1511–1518. doi: 10.1093/cid/cix1060. - DOI - PMC - PubMed
    1. Nichols G.L., Gillingham E.L., Macintyre H.L., Vardoulakis S., Hajat S., Sarran C.E., Amankwaah D., Phalkey R. Coronavirus seasonality, respiratory infections and weather. BMC Infect. Dis. 2021;21:1101. doi: 10.1186/s12879-021-06785-2. - DOI - PMC - PubMed
    1. Phillips N. The coronavirus is here to stay—Here’s what that means. Nature. 2021;590:382–384. doi: 10.1038/d41586-021-00396-2. - DOI - PubMed
    1. Musuuza J.S., Watson L., Parmasad V., Putman-Buehler N., Christensen L., Safdar N. Prevalence and outcomes of coinfection and superinfection with SARS-CoV-2 and other pathogens: A systematic review and meta-analysis. PLoS ONE. 2021;16:e0251170. doi: 10.1371/journal.pone.0251170. - DOI - PMC - PubMed
    1. Stowe J., Tessier E., Zhao H., Guy R., Muller-Pebody B., Zambon M., Andrews N., Ramsay M., Lopez Bernal J. Interactions between SARS-CoV-2 and influenza, and the impact of coinfection on disease severity: A test-negative design. Int. J. Epidemiol. 2021;50:1124–1133. doi: 10.1093/ije/dyab081. - DOI - PMC - PubMed