. 2024 Feb 3;16(2):247.
doi: 10.3390/v16020247.

Porcine Sapovirus Protease Controls the Innate Immune Response and Targets TBK1

Affiliations

Porcine Sapovirus Protease Controls the Innate Immune Response and Targets TBK1

Iliana Georgana et al. Viruses. .

Abstract

Human sapoviruses (HuSaVs) and noroviruses are considered the leading cause of acute gastroenteritis worldwide. While extensive research has focused on noroviruses, our understanding of sapoviruses (SaVs) and their interactions with the host's immune response remains limited. HuSaVs have been challenging to propagate in vitro, making the porcine sapovirus (PSaV) Cowden strain a valuable model for studying SaV pathogenesis. In this study we show, for the first time, that PSaV Cowden strain has mechanisms to evade the host's innate immune response. The virus 3C-like protease (NS6) inhibits type I IFN production by targeting TBK1. Catalytically active NS6, both during ectopic expression and during PSaV infection, targets TBK1 which is then led for rapid degradation by the proteasome. Moreover, deletion of TBK1 from porcine cells led to an increase in PSaV titres, emphasizing its role in regulating PSaV infection. Additionally, we successfully established PSaV infection in IPEC-J2 cells, an enterocytic cell line originating from the jejunum of a neonatal piglet. Overall, this study provides novel insights into PSaV evasion strategies, opening the way for future investigations into SaV-host interactions, and enabling the use of a new cell line model for PSaV research.

Keywords: IPEC-J2; NS6; TBK1; caliciviruses; innate immunity; protease; proteasomal degradation; sapovirus; type I IFN.


Conflict of interest statement

The authors declare no conflicts of interest.

Figures

Figure 1
Figure 1
PSaV NS6 is a type I IFN antagonist. (A) Schematic of 5BR assay, first described in [27]. (B) HEK293T cells were transfected in triplicate with a reporter plasmid encoding firefly luciferase under the control of IFN-β promoter, a Renilla luciferase transfection control, a RIG-I expressing plasmid, and 50 ng/well of any of the indicated Pro-Pol fusion plasmids. Then, 4 h post-transfection, cells were stimulated with poly(I:C) (2 μg/mL), or left unstimulated (NS). Cells were harvested in passive lysis buffer 36 h post-transfection and firefly luciferase activity was measured and normalised to the Renilla luciferase activity. Each sample was compared to the average value of EV control to obtain the fold increase. (C) HEK293T cells were transfected in triplicate with the IFN-β reporter, the Renilla luciferase control reporter, and the indicated amounts of ProWT-PolMUT fusion construct. Empty vector (EV) was added to samples when necessary to keep the final amount of DNA transfected as 50 ng/well in all samples. Stimulation was achieved by co-transfection of RIG-I-CARD expression plasmid (5 ng/well). After 24 h, cells were lysed in passive lysis buffer, and firefly luciferase was measured and normalised to the Renilla luciferase. Fold change was obtained by comparing each stimulated sample to the average value of its unstimulated control. Data shown are representative of 3 independent experiments where each independent experiment was performed with a minimal of 3 wells for each condition. Statistical significance was measured via a Student’s t-test. **** p ≤ 0.0001. Error bars represent standard error of the mean.
Figure 2
Figure 2
PSaV NS6 restricts type I IFN activation at the level of TBK1. HEK293T cells were transfected in triplicate with the IFN-β firefly luciferase reporter, the Renilla luciferase control reporter, and 50 ng/well of EV, ProWT-PolMUT or ProMUT-PolMUT. Cells were also co-transfected with EV as a non-stimulated control, or (A) RIG-I-CARD (5 ng/well), (B) TBK1 (40 ng/well), or (C) IRF3-5D (40 ng/well) expression plasmids to activate the type I IFN pathway. Then, 24 h post-transfection, cells were lysed, and firefly luciferase was measured and normalised to the Renilla luciferase. Each stimulated sample was compared to the average value of its unstimulated control to obtain a fold increase. Immunoblots underneath each graph show expression levels of the different overexpressed proteins, or GAPDH. The positions of molecular mass markers in kDa are indicated on the left of each immunoblot. Data shown are representative of 3 independent experiments, where each independent experiment was performed with a minimal of 3 wells for each condition. (D) Schematic representation of NS6 inhibiting at the level of TBK1, leading to type I IFN suppression. Statistical analysis was performed within a single experiment, and significance was measured by a Student’s t-test. **** p ≤ 0.0001. Error bars represent standard error of the mean.
Figure 3
Figure 3
NS6 interacts with TBK1 and modulates its protein levels. (A) HEK293T cells were transfected for 24 h with 2 μg of HA-NS6-7 where NS6 was WT (ProWTPolWT), or MUT (ProMUTPolWT), together with 2 μg of FLAG-pTBK1, or 0.5 μg of GFP-FLAG. Cells were lysed, loaded onto an SDS-PAGE (2 μg/sample), separated, and analysed by immunoblotting with the indicated antibodies. (B) HEK293T cells were co-transfected with 2 μg HA-tagged NS6-7 WT or MUT (as described above), together with 2 μg of FLAG-pTBK1, or FLAG-pTBK1-HA. Cells were lysed 24 h later, and samples were loaded onto an SDS-PAGE (2 μg/sample), separated, and immunoblotted with the indicated antibodies. (C,D) HEK293T cells were transfected with 2 μg of EV, or PSaV, or HuSaV NS6-7, both mCherry-tagged, along with (C) 2 μg of FLAG-pTBK1, or (D) 0.5 μg GFP-FLAG. Then, 24 h later, cells were lysed, loaded onto an SDS-PAGE (2 μg/sample), separated, and analysed by immunoblotting with the indicated antibodies. (E) HEK293T cells were co-transfected with 4 μg FLAG-pTBK1 and 4 μg of HA-ProWTPolWT, or HA-ProMUTPolWT (also mentioned HA-NS6-7 in the text), or 1 μg HA-GFP. Cells were harvested 24 h later, lysed, and subjected to FLAG IP. Proteins were separated by SDS-PAGE, and analysed by immunoblotting with the indicated antibodies. Data shown are representative of at least 2 independent experiments. The positions of molecular mass markers in kDa are indicated on the left of each immunoblot.
Figure 4
Figure 4
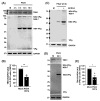
Protein levels of TBK1 are reduced during PSaV infection. (A) LLC-PK1 cells mock-infected, or infected with PSaV at 5 TCID50/cell in the presence of 200 μM GCDCA for the indicated h pi. All samples were lysed together, loaded onto a NuPAGE (10 μg/sample), and proteins were separated and analysed by immunoblotting. Immunoblot shown is the representative of 2 independent experiments. (B) Arbitrary units (AU) of TBK1 normalised to GAPDH, from mock-, or PSaV-infected LLC-PK1 cells. In all 3 experiments, cells were infected at 5 TCID50/cell and lysed at 16 h pi. (C) IPEC-J2 cells mock-infected, or infected with PSaV at 5 TCID50/cell in the presence or absence of GCDCA (300 μM). Cells were lysed at 24 h pi, loaded onto a NuPAGE (10 μg/sample), separated, and immunoblotted with the indicated antibodies. Immunoblot shown is the representative of 3 independent experiments. (D) IPEC-J2 cells were infected with PSaV at 5 TCID50/cell in the presence of 300 μM GCDCA, and they were lysed at 24 h pi. Proteins were separated by NuPAGE (10 μg/sample), and immunoblotting analysis was followed with the indicated antibodies. Immunoblot shown is the representative of 3 independent experiments. (E) AU of TBK1 normalised to GAPDH, of mock- or PSaV-infected IPEC-J2 cells. In all 3 experiments, cells were infected with PSaV at 5 TCID50/cell and cells were lysed at 24 h pi. For all the immunoblots, antibodies used are shown on the right, whereas precursor and mature VPg were detected by an anti-VPg antibody. Positions of molecular mass markers are indicated on the left. Statistical significance from 3 independent experiments was measured by a Student’s t-test. * p ≤ 0.05, ** p ≤ 0.01. Error bars represent standard error of the mean.
Figure 5
Figure 5
TBK1 is targeted for proteasomal degradation following cleavage by NS6. (A) HEK293T cells were co-transfected with 1 μg of HA-NS6-7 where NS6 was WT (ProWTPolWT), or MUT (ProMUTPolWT), and 1 μg of FLAG-pTBK1. Then, 5 h post-transfection, cells were treated with zVAD-FMK (10 and 20 μM), or NH4Cl (10 and 20 mM), MG132 or lactacystin (both at 5 and 10 μM), or DMSO as control for a total of 24 h. Cells were then lysed, loaded onto an SDS-PAGE (2 μg/sample), separated, and analysed by immunoblotting with the indicated antibodies. Positions of molecular mass markers in kDa are indicated on the left. Blue arrow indicates the unspecific band. Immunoblot shown is representative of 3 independent experiments. (B) LLC-PK1 cells were infected with PSaV at 5 TCID50/cell in the presence of 200 μM GCDCA. Post inoculum incubation, cells were treated with 20 μM zVAD-FMK or 20 μM MG132, DMSO as control, and infection was left for a total of 16 h. Cells were lysed, samples were loaded onto a NuPAGE (10 μg/sample), and proteins were separated and analysed by immunoblotting. Antibodies used are shown on the right, and precursor and mature VPg were detected by an anti-VPg antibody. Positions of molecular mass markers in kDa are indicated on the left. Immunoblot shown is representative of 2 independent experiments. (C) AU of TBK1 normalised to GAPDH, of mock- or PSaV-infected LLC-PK1 cells from 2 independent experiments. In both experiments, cells were infected with PSaV at 5 TCID50/cell and cells were treated with the drugs as described in (B). Statistical significance from 3 independent experiments was measured by a Student’s t-test. ns: non-significant, * p ≤ 0.05. Error bars represent standard error of the mean.
Figure 6
Figure 6
PSaV infection in TBK1-deficient cells results in higher viral titres. (A) Schematic of CRISPR-Cas9-mediated knockout strategy targeting porcine Tbk1 exon 3 and DNA sequences of LLC-PK1 WT and KO cells. Both alleles of KO clone showed the same frameshifting, and the chromatogram is included below. (B) Immunoblot analysis of LLC-PK1 parental (Par), EV, and KO lines for endogenous levels of TBK1 and GAPDH. The positions of molecular mass markers in kDa are shown on the left. (C) LLC-PK1 WT (EV) and TBK1 KO cells were transfected with 1 μg/mL poly(I:C) or left untransfected as non-stimulated (NS) control. Then, 6 h later, cells were lysed and total RNA was extracted, followed by RT-qPCR. The IFN-β levels were compared to β-actin levels of each sample, and then everything was compared to EV NS to obtain fold increase. Data shown are representatives of 2 independent experiments done in triplicate. (D) TBK1 WT (EV) and KO LLC-PK1 cells were infected with PSaV at 1 TCID50/cell in the presence of 200 μM GCDCA for 24 h. Total virus yield was then measured by TCID50. Data shown are representatives of 2 independent experiments performed in triplicate. Statistical significance was measured via a Student’s t-test. ns: non-significant, ** p ≤ 0.01, **** p ≤ 0.0001. Error bars represent standard error of the mean.

References

    1. Li J., Zhang W., Cui L., Shen Q., Hua X. Metagenomic identification, genetic characterization and genotyping of porcine sapoviruses. Infect. Genet. Evol. 2018;62:244–252. doi: 10.1016/j.meegid.2018.04.034. - DOI - PubMed
    1. Yinda C.K., Conceição-Neto N., Zeller M., Heylen E., Maes P., Ghogomu S.M., Van Ranst M., Matthijnssens J. Novel highly divergent sapoviruses detected by metagenomics analysis in straw-colored fruit bats in Cameroon. Emerg. Microbes Infect. 2017;6:e38. doi: 10.1038/emi.2017.20. - DOI - PMC - PubMed
    1. Oka T., Wang Q., Katayama K., Saif Linda J. Comprehensive Review of Human Sapoviruses. Clin. Microbiol. Rev. 2015;28:32–53. doi: 10.1128/CMR.00011-14. - DOI - PMC - PubMed
    1. Oka T., Katayama K., Ogawa S., Hansman G.S., Kageyama T., Ushijima H., Miyamura T., Takeda N. Proteolytic Processing of Sapovirus ORF1 Polyprotein. J. Virol. 2005;79:7283–7290. doi: 10.1128/JVI.79.12.7283-7290.2005. - DOI - PMC - PubMed
    1. Li T.-C., Kataoka M., Doan Y.H., Saito H., Takagi H., Muramatsu M., Oka T. Characterization of a Human Sapovirus Genotype GII.3 Strain Generated by a Reverse Genetics System: VP2 Is a Minor Structural Protein of the Virion. Viruses. 2022;14:1649. doi: 10.3390/v14081649. - DOI - PMC - PubMed

Substances

LinkOut - more resources