. 2024 Feb 8;16(2):270.
doi: 10.3390/v16020270.

Robust Approaches to the Quantitative Analysis of Genome Formula Variation in Multipartite and Segmented Viruses

Affiliations

Robust Approaches to the Quantitative Analysis of Genome Formula Variation in Multipartite and Segmented Viruses

Marcelle L Johnson et al. Viruses. .

Abstract

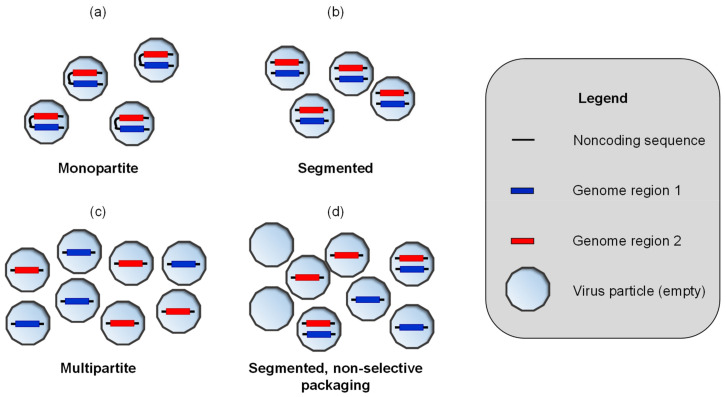
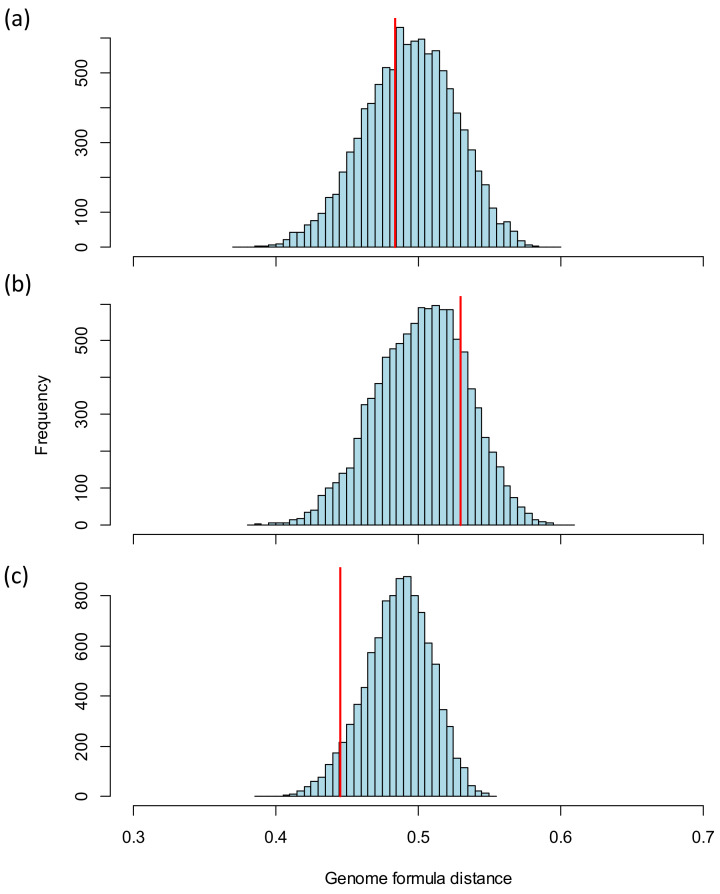
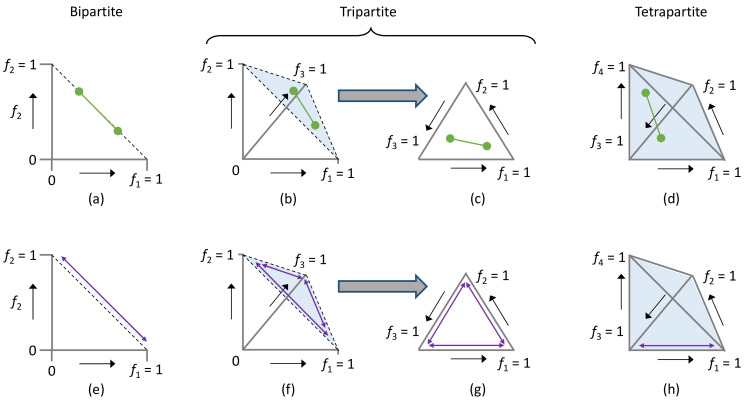
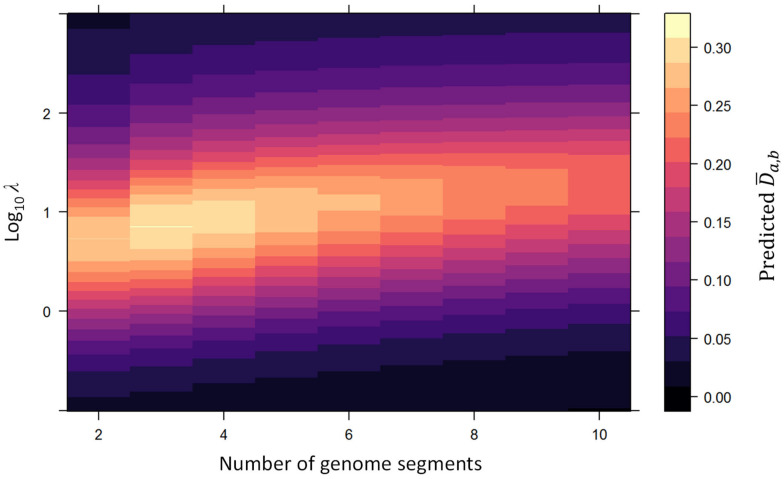
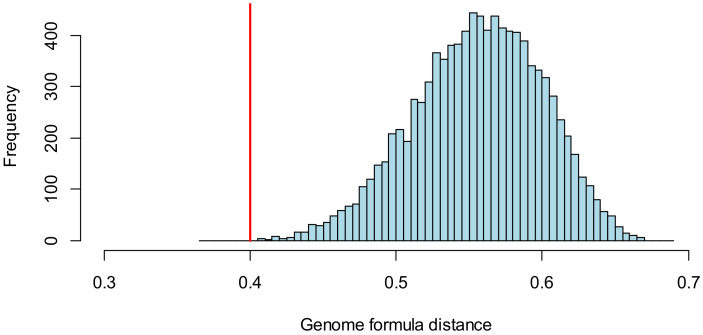
When viruses have segmented genomes, the set of frequencies describing the abundance of segments is called the genome formula. The genome formula is often unbalanced and highly variable for both segmented and multipartite viruses. A growing number of studies are quantifying the genome formula to measure its effects on infection and to consider its ecological and evolutionary implications. Different approaches have been reported for analyzing genome formula data, including qualitative description, applying standard statistical tests such as ANOVA, and customized analyses. However, these approaches have different shortcomings, and test assumptions are often unmet, potentially leading to erroneous conclusions. Here, we address these challenges, leading to a threefold contribution. First, we propose a simple metric for analyzing genome formula variation: the genome formula distance. We describe the properties of this metric and provide a framework for understanding metric values. Second, we explain how this metric can be applied for different purposes, including testing for genome-formula differences and comparing observations to a reference genome formula value. Third, we re-analyze published data to illustrate the applications and weigh the evidence for previous conclusions. Our re-analysis of published datasets confirms many previous results but also provides evidence that the genome formula can be carried over from the inoculum to the virus population in a host. The simple procedures we propose contribute to the robust and accessible analysis of genome-formula data.

Keywords: RT-PCR; genome formula; multipartite virus; plant virus; segmented virus; sequencing; statistical analysis; virus ecology; virus evolution.


Conflict of interest statement

The authors declare no conflicts of interest. The funders had no role in the design of the study; in the collection, analyses, or interpretation of data; in the writing of the manuscript; or in the decision to publish the results.

Figures

Figure 1
Figure 1
We provide a schematic illustration of the variation in the distribution of genome segments (nucleic acid molecules) over virus particles. A legend is given on the far right. In each case shown, we assume the virus genome consists of the two identical coding genome regions, identified by blue and red fills, forming one or two segments. (a) Monopartite viruses have a single genome segment. Note that the two genome regions form a single molecule in the illustration. (b) Segmented viruses have multiple genome segments: two genome segments in this example. These viruses package a full complement of genome segments into each virus particle. (c) A multipartite virus with two genome segments is shown. Each segment is packaged individually into a virus particle. Infection will depend on the transmission of multiple virus particles, as both a blue and a red segment are needed. (d) A segmented virus with non-selective packaging is shown. The illustration is a hypothetical distribution based only on the observation that for some segmented viruses, many virus particles have an incomplete set of genome segments [5,19]. This organization is included to highlight that many distributions of genome segments over virus particles are possible, and that the genome formula of segmented viruses does not have to be balanced (i.e., not 1:1 ratio of genome segments).
Figure A1
Figure A1
Resampling approach for testing for an effect of inoculum on the AMV genome formula measured in different tissues. The blue bars in the histogram indicate the frequency of predicted mean genome formula distance for 104 resampled datasets, in which observations in the inoculated leaf were randomly assigned to an inoculum. The red line indicates the genome formula distance for the actual data, which in all cases falls well within the 99% confidence interval of the distribution predicted by resampling (see Table 4). (a) Results for the middle leaf of the plant are shown. (b) Results for the upper leaf are shown. (c) Results for the rest of the plant tissues are shown.
Figure 2
Figure 2
Here, we illustrate the genome formula distance metric (top panels, green lines) and its maximum possible distance for different numbers of genome segments (bottom panels, purple arrows). Figure axes are genome segment frequencies (f) for 2 (panels (a,b)), 3 (panels (b,c,f,g)), or 4 genome segments (panels (d,h)). (a) For a bipartite virus, we illustrate two possible genome formula values with green points and the distance between them with a line. Note that for the bipartite virus, all possible genome formula values fall on the dotted line connecting (1,0) and (0,1). (b) For a tripartite virus, we illustrate two possible genome formula values in three-dimensional genome formula space. As the sum of relative frequencies is 1, all possible genome formula values fall in the triangular plane illustrated by the dotted lines and light blue shading. (c) As all values fall in the same plane in panel b, genome formula values for a tri-segmented virus are often illustrated in only this plane, resulting in a ternary plot. (d) Two genome formula values and their distance are illustrated for a tetrapartite virus in a quarternary plot. All values in the tetrahedron represent possible genome formula values, as indicated by the light blue shading. (e) The maximum possible genome formula distance for a bipartite virus is simply the line connecting the points (1,0) and (0,1). (f) For the tripartite virus, the longest possible distance in the genome formula space is attained along its borders, resulting in an identical maximum genome formula distance to the bipartite virus. The light blue shading indicates the possible space for genome formula values. (g) The outcome described in panel f is clearer in the ternary plot of the genome formula space. (h) For a tetrapartite virus, there is no distance between two points in the genome formula space that is longer than the maximum distance for the bipartite and tripartite viruses. This maximum distance occurs at the edges of the genome formula space, as indicated by the light blue shading, connecting the vertices, which represent the presence of a single segment. To keep the panel clear, we only illustrate this for one edge for a tetrapartite virus, although there are six such edges.
Figure 3
Figure 3
The effects of the number of segments and bottleneck size on the predicted genome formula distance are illustrated. The x-axis indicates the number of virus genome segments, whereas the y-axis indicates the log-transformed number of infection founders (λ). For all combinations of these values, we predicted the mean genome formula distance D¯a,b, a value indicated by the heat according to the legend on the far right. We used these simulation results to determine the highest value of D¯a,b for each number of genome segments, a value we term D¯a,bdrift. Note that the highest mean distance values occur at intermediate values of λ, as well as being associated with higher values of λ as the number of segments is increased.
Figure 4
Figure 4
Resampling approach to testing for an effect of inoculum on the genome formula measured in the inoculated leaf. The blue bars in the histogram indicate the frequency of predicted mean genome formula distance for 104 resampled datasets, in which observations in the inoculated leaf were randomly assigned to an inoculum. The red line indicates the genome formula distance for the actual data.

Similar articles

References

    1. Sicard A., Michalakis Y., Gutiérrez S., Blanc S. The strange lifestyle of multipartite viruses. PLoS Pathog. 2016;12:e1005819. doi: 10.1371/journal.ppat.1005819. - DOI - PMC - PubMed
    1. Michalakis Y., Blanc S. The curious strategy of multipartite viruses. Annu. Rev. Virol. 2020;7:203–218. doi: 10.1146/annurev-virology-010220-063346. - DOI - PubMed
    1. Sánchez-Navarro J.A., Zwart M.P., Elena S.F. Effects of the number of genome segments on primary and systemic infections with a multipartite plant RNA virus. J. Virol. 2013;87:10805–10815. doi: 10.1128/JVI.01402-13. - DOI - PMC - PubMed
    1. Fulton R.W. The effect of dilution on Necrotic ringspot virus infectivity and the enhancement of infectivity by noninfective virus. Virology. 1962;18:477–485. doi: 10.1016/0042-6822(62)90038-7. - DOI - PubMed
    1. Wichgers Schreur P.J., Kortekaas J. Single-molecule FISH reveals non-selective packaging of Rift Valley fever virus genome segments. PLoS Pathog. 2016;12:e1005800. doi: 10.1371/journal.ppat.1005800. - DOI - PMC - PubMed

LinkOut - more resources