

Assessing Cognitive Workload in Motor Decision-Making through Functional Connectivity Analysis: Towards Early Detection and Monitoring of Neurodegenerative Diseases
- PMID: 38400247
- PMCID: PMC10893317
- DOI: 10.3390/s24041089
Assessing Cognitive Workload in Motor Decision-Making through Functional Connectivity Analysis: Towards Early Detection and Monitoring of Neurodegenerative Diseases
Abstract
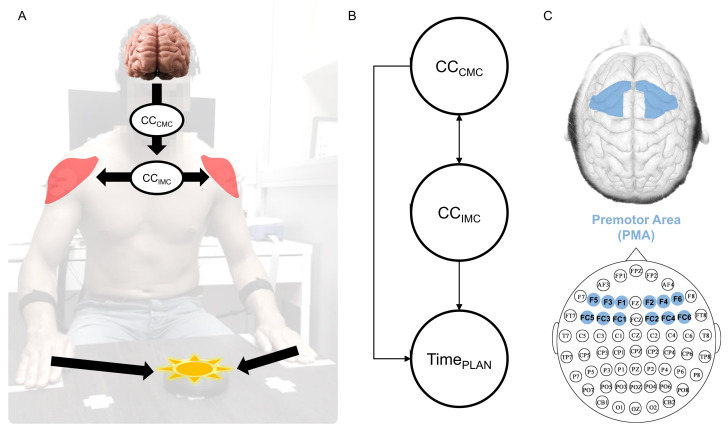
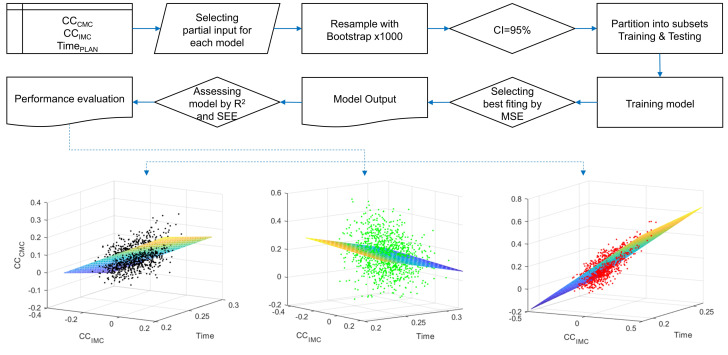
Neurodegenerative diseases (NDs), such as Alzheimer's, Parkinson's, amyotrophic lateral sclerosis, and frontotemporal dementia, among others, are increasingly prevalent in the global population. The clinical diagnosis of these NDs is based on the detection and characterization of motor and non-motor symptoms. However, when these diagnoses are made, the subjects are often in advanced stages where neuromuscular alterations are frequently irreversible. In this context, we propose a methodology to evaluate the cognitive workload (CWL) of motor tasks involving decision-making processes. CWL is a concept widely used to address the balance between task demand and the subject's available resources to complete that task. In this study, multiple models for motor planning during a motor decision-making task were developed by recording EEG and EMG signals in n=17 healthy volunteers (9 males, 8 females, age 28.66±8.8 years). In the proposed test, volunteers have to make decisions about which hand should be moved based on the onset of a visual stimulus. We computed functional connectivity between the cortex and muscles, as well as among muscles using both corticomuscular and intermuscular coherence. Despite three models being generated, just one of them had strong performance. The results showed two types of motor decision-making processes depending on the hand to move. Moreover, the central processing of decision-making for the left hand movement can be accurately estimated using behavioral measures such as planning time combined with peripheral recordings like EMG signals. The models provided in this study could be considered as a methodological foundation to detect neuromuscular alterations in asymptomatic patients, as well as to monitor the process of a degenerative disease.
Keywords: cognitive workload; decision-making; functional connectivity; motor planning; neurodegenerative diseases; statistical modeling.
Conflict of interest statement
The authors declare no conflicts of interest.
Figures


Similar articles
-
Brain-hemispheric differences in the premotor area for motor planning: An approach based on corticomuscular connectivity during motor decision-making.Neuroimage. 2025 May 15;312:121230. doi: 10.1016/j.neuroimage.2025.121230. Epub 2025 Apr 17. Neuroimage. 2025. PMID: 40252879 Free PMC article.
-
The influence of unilateral contraction of hand muscles on the contralateral corticomuscular coherence during bimanual motor tasks.Neuropsychologia. 2016 May;85:199-207. doi: 10.1016/j.neuropsychologia.2016.03.028. Epub 2016 Mar 24. Neuropsychologia. 2016. PMID: 27018484
-
Functional connectivity in the neuromuscular system underlying bimanual coordination.J Neurophysiol. 2016 Dec 1;116(6):2576-2585. doi: 10.1152/jn.00460.2016. Epub 2016 Sep 14. J Neurophysiol. 2016. PMID: 27628205 Free PMC article.
-
Objective Assessment of Cognitive Workload in Surgery: A Systematic Review.Ann Surg. 2025 Jun 1;281(6):942-951. doi: 10.1097/SLA.0000000000006370. Epub 2024 Jun 7. Ann Surg. 2025. PMID: 38847099 Free PMC article.
-
EEG power spectral measures of cognitive workload: A meta-analysis.Psychophysiology. 2022 Jun;59(6):e14009. doi: 10.1111/psyp.14009. Epub 2022 Feb 6. Psychophysiology. 2022. PMID: 35128686 Review.
Cited by
-
Decision-Making Time Analysis for Assessing Processing Speed in Athletes during Motor Reaction Tasks.Sports (Basel). 2024 May 29;12(6):151. doi: 10.3390/sports12060151. Sports (Basel). 2024. PMID: 38921845 Free PMC article.
-
Brain-hemispheric differences in the premotor area for motor planning: An approach based on corticomuscular connectivity during motor decision-making.Neuroimage. 2025 May 15;312:121230. doi: 10.1016/j.neuroimage.2025.121230. Epub 2025 Apr 17. Neuroimage. 2025. PMID: 40252879 Free PMC article.
References
-
- McMackin R., Muthuraman M., Groppa S., Babiloni C., Taylor J.P., Kiernan M.C., Nasseroleslami B., Hardiman O. Measuring network disruption in neurodegenerative diseases: New approaches using signal analysis. J. Neurol. Neurosurg. Psychiatry. 2019;90:1011–1020. doi: 10.1136/jnnp-2018-319581. - DOI - PMC - PubMed
-
- Nasseroleslami B., Dukic S., Broderick M., Mohr K., Schuster C., Gavin B., McLaughlin R., Heverin M., Vajda A., Iyer P.M., et al. Characteristic Increases in EEG Connectivity Correlate With Changes of Structural MRI in Amyotrophic Lateral Sclerosis. Cereb. Cortex. 2017;29:27–41. doi: 10.1093/cercor/bhx301. - DOI - PubMed
MeSH terms
LinkOut - more resources
Full Text Sources
Medical
