

Engineering Features from Raw Sensor Data to Analyse Player Movements during Competition
- PMID: 38400466
- PMCID: PMC10893073
- DOI: 10.3390/s24041308
Engineering Features from Raw Sensor Data to Analyse Player Movements during Competition
Abstract
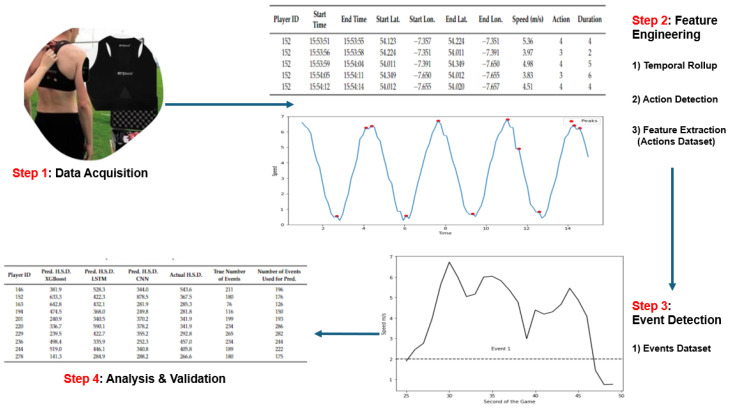
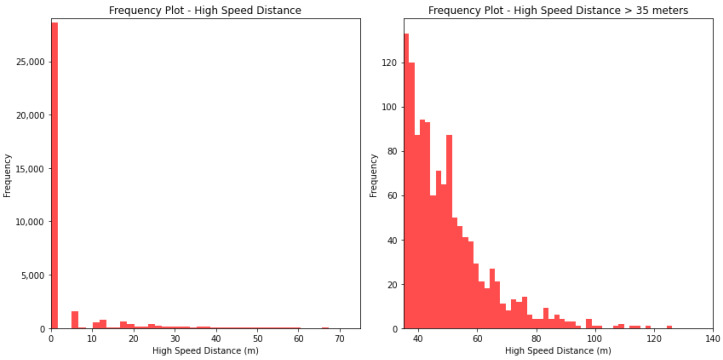
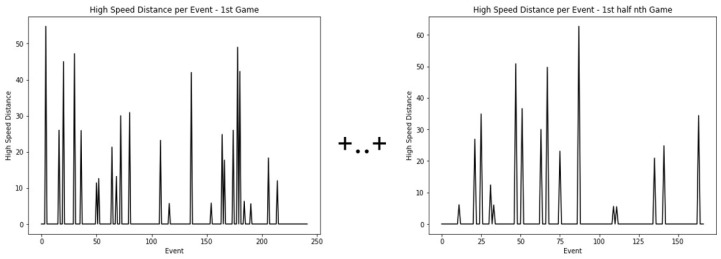
Research in field sports often involves analysis of running performance profiles of players during competitive games with individual, per-position, and time-related descriptive statistics. Data are acquired through wearable technologies, which generally capture simple data points, which in the case of many team-based sports are times, latitudes, and longitudes. While the data capture is simple and in relatively high volumes, the raw data are unsuited to any form of analysis or machine learning functions. The main goal of this research is to develop a multistep feature engineering framework that delivers the transformation of sequential data into feature sets more suited to machine learning applications.
Keywords: feature engineering; machine learning; wearable devices.
Conflict of interest statement
The authors declare no conflicts of interest.
Figures
Similar articles
-
A multidimensional database of in-game player movements (Actions and events) in gaelic football.Data Brief. 2024 Oct 28;57:111082. doi: 10.1016/j.dib.2024.111082. eCollection 2024 Dec. Data Brief. 2024. PMID: 39687360 Free PMC article.
-
Estimating oxygen uptake in simulated team sports using machine learning models and wearable sensor data: A pilot study.PLoS One. 2025 Apr 21;20(4):e0319760. doi: 10.1371/journal.pone.0319760. eCollection 2025. PLoS One. 2025. PMID: 40258017 Free PMC article.
-
Combining wearable sensor signals, machine learning and biomechanics to estimate tibial bone force and damage during running.Hum Mov Sci. 2020 Dec;74:102690. doi: 10.1016/j.humov.2020.102690. Epub 2020 Oct 22. Hum Mov Sci. 2020. PMID: 33132194 Free PMC article.
-
The Validity and Reliability of Wearable Microtechnology for Intermittent Team Sports: A Systematic Review.Sports Med. 2021 Mar;51(3):549-565. doi: 10.1007/s40279-020-01399-1. Epub 2020 Dec 24. Sports Med. 2021. PMID: 33368031
-
Data-driven modeling and prediction of blood glucose dynamics: Machine learning applications in type 1 diabetes.Artif Intell Med. 2019 Jul;98:109-134. doi: 10.1016/j.artmed.2019.07.007. Epub 2019 Jul 26. Artif Intell Med. 2019. PMID: 31383477 Review.
Cited by
-
A multidimensional database of in-game player movements (Actions and events) in gaelic football.Data Brief. 2024 Oct 28;57:111082. doi: 10.1016/j.dib.2024.111082. eCollection 2024 Dec. Data Brief. 2024. PMID: 39687360 Free PMC article.
References
-
- Camous F., McCann D., Roantree M. Capturing personal health data from wearable sensors; Proceedings of the 2008 International Symposium on Applications and the Internet; Turku, Finland. 28 July–1 August 2008; New York, NY, USA: IEEE; 2008. pp. 153–156.
-
- Miškinytė A., Dėdelė A. Objective assessment of physical activity patterns based on accelerometer and GPS data in adults. Travel Behav. Soc. 2021;25:112–119. doi: 10.1016/j.tbs.2021.07.002. - DOI
-
- Bennett T., Marshall P., Barrett S., Malone J.J., Towlson C. Quantifying high-speed running in rugby league: An insight into practitioner applications and perceptions. Int. J. Sports Sci. Coach. 2022;18:1530–1540. doi: 10.1177/17479541221112825. - DOI
-
- Calderón-Pellegrino G., Gallardo L., Garcia-Unanue J., Felipe J.L., Hernandez-Martin A., Paredes-Hernández V., Sánchez-Sánchez J. Physical demands during the game and compensatory training session (MD+ 1) in elite football players using global positioning system device. Sensors. 2022;22:3872. doi: 10.3390/s22103872. - DOI - PMC - PubMed
MeSH terms
LinkOut - more resources
Full Text Sources
