Review
. 2024 Jul;28(7):608-616.
doi: 10.1007/s10157-023-02456-5. Epub 2024 Feb 24.

Urine oxygenation predicts COVID-19 risk

Affiliations
Review

Urine oxygenation predicts COVID-19 risk

Eisei Noiri et al. Clin Exp Nephrol. 2024 Jul.

Abstract

Since February, 2023, the omicron variant has accounted for essentially all new coronavirus infections in Japan. If future infections involve mutant strains with the same level of infectivity and virulence as omicron, the government's basic policy will be to prevent the spread of infection, without compromising socioeconomic activities. Objectives include protecting pregnant women and elderly persons, and focusing on citizens requiring hospitalization and those at risk of serious illness, without imposing new social restrictions. Although the government tries to raise public awareness through education, most people affected by COVID-19 stay at home, and by the time patients become aware of the seriousness of their disease, it has often reached moderate or higher severity. In this review, we discuss why this situation persists even though the disease seems to have become milder with the shift from the delta variant to omicron. We also propose a pathophysiological method to determine the risk of severe illness. This assessment can be made at home in the early stages of COVID-19 infection, using urine analysis. Applicability of this method to drug discovery and development is also discussed.

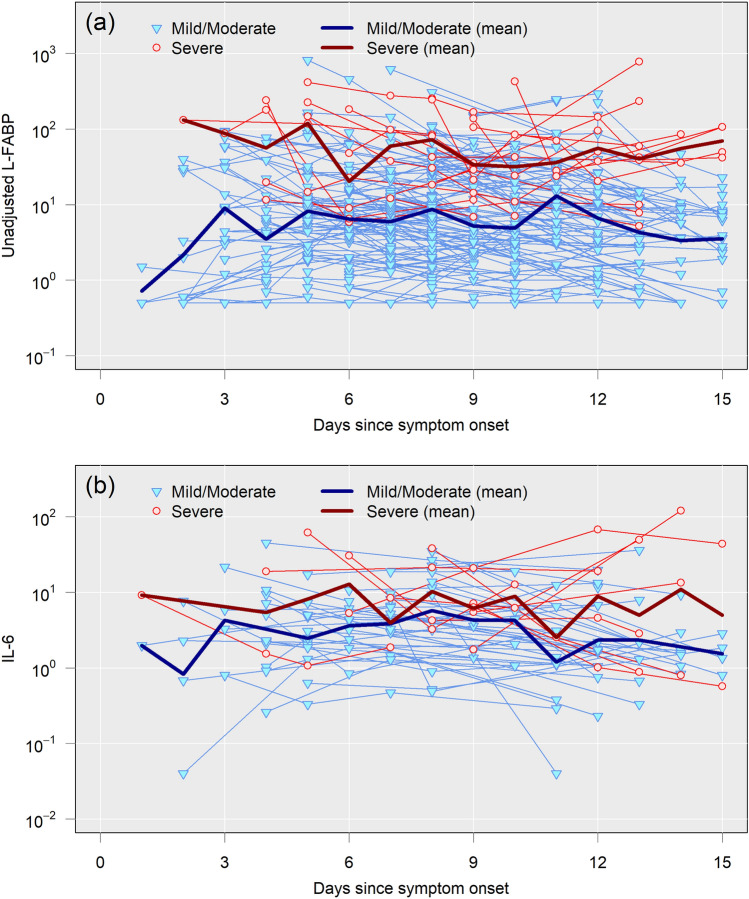
Keywords: Acute respiratory distress syndrome (ARDS); FABP1; L-type fatty acid-binding protein (L-FABP); Systemic inflammatory response syndrome (SIRS); Urine.


Conflict of interest statement

None of the authors have conflict of interest regarding the topics discussed here.

Figures

Fig. 1
Fig. 1
SpO2 level at COVID-19 diagnosis and maximum ΔFiO2 one week thereafter. Left: Patients were classified into two groups based on a net L-FABP value (10 ng/mL), and SpO2 values in the horizontal axis were plotted individually upon admission. The median value was 97% for patients above 10, and 96% for patients below 10. There was statistical difference between two groups, p < 0.05 using t-test. Right: The proportion of patients who required additional oxygenation after admission was demonstrated through the evaluation of the maximum ΔFiO2 increment (FiO2 increase) within 1 week after admission. Magenta color indicates the percentage of cases requiring more oxygen after admission for respiratory management. Chi-square detected significant difference between two groups (p < 1 × 10–9)
Fig. 2
Fig. 2
Respiratory severity with or without pneumonia at the time of COVID-19 diagnosis and one week thereafter. Left: Patients were classified into two groups based on a net L-FABP value of 10 ng/mL, and the percentage of patients with or without pneumonia by chest X-ray. Chi-square found significant differences in the presence of pneumonia on admission between two groups (p < 1 × 10–21). Right: Respiratory severity class percentages 1 week after admission. The severity classification is as follows: 1. No symptoms in radiogram (green), 2. Pneumonia diagnosed by chest X-ray (light green), 3. Oxygen supply needed (orange), 4. Respiratory mechanical ventilation required (red). Colors indicate disease severity. The most severe condition in a week was assigned in each case. Chi-square found statistical differences between groups (p < 1 × 10–20) and further found the oxygen requirement in higher L-FABP group (ratio of orange and red; p < 1 × 10–10)
Fig. 3
Fig. 3
ROC curves to detect severe or mild COVID-19 cases (All cases: n = 224). ad, ROC curve analysis was performed for all cases (n = 224) to detect severe or mild groups, using either adjusted or unadjusted urinary L-FABP levels. Resulting cut-off values were; adjusted L-FABP to discriminate severe cases a 24.1 μg/gCre (specificity 78.0% and sensitivity 90.0%, area under the receiver operating characteristic curve [AUC] 84.3%) and mild cases b 6.1 μg/gCre (specificity 70.3% and sensitivity 86.4%, AUC 85.4%), and unadjusted L-FABP to discriminate severe cases c 32.1 ng/mL (specificity 78.0% and sensitivity 80.0%, AUC 83.9%), and mild cases d 7.51 ng/mL (specificity 63.3% and sensitivity 87.9%, AUC 82.3%)
Fig. 4
Fig. 4
ROC curves to detect severe or mild cases of COVID-19 of initially mild cases. ad ROC curve analysis was performed for mild cases at diagnosis of COVID-19 (n = 173) to detect severe or mild groups using adjusted urinary L-FABP. Resulting cut-off values were; severe cases a 35.9 μg/gCre (specificity 93.6% and sensitivity 100%, AUC 96.3%), mild cases, b: 6.1 μg/gCre (specificity 71.4% and sensitivity 89.5%, AUC 85.0%). ROC curve analysis to detect severe or mild groups using adjusted urinary L-FABP. Resulting cut-off values were; severe cases c 31.0 ng/mL (specificity 85.3% and sensitivity 100%, AUC 93.6%), mild cases d 10.9 ng/mL (specificity 70.1% and sensitivity 89.5%, AUC 84.9%)
Fig. 5
Fig. 5
Urinary L-FABP in a mouse intratracheal LPS injection model16. Bronchoalveolar lavage fluid protein levels differ between the 50 µg and 200 µg group (n = 5–7/group, p < 0.05 vs. saline injection), denoting the difference of severity
Fig. 6
Fig. 6
Correlation analysis and ROC analysis to detect severe or mild COVID-19 between urine unadjusted L-FABP and serum IL-6. ad ROC curve analysis was performed to detect severe or mild cases using unadjusted urinary L-FABP or serum IL-6. Resulting cut-off values were unadjusted L-FABP; severe cases a 51.4 ng/mL (specificity 81.8% and sensitivity 100%, area under the receiver operating characteristic curve [AUC] 88.6%), mild cases b 51.4 ng/mL (specificity 100% and sensitivity 100%, AUC 100%), and IL-6; severe cases c 5.2 pg/mL (specificity 72.7% and sensitivity 100%, AUC 81.8%), mild cases d 5.2 pg/mL (specificity 88.9% and sensitivity 100%, AUC 92.6%)
Fig. 7
Fig. 7
Dynamics of L-FABP and IL-6 during the first 15 days after COVID-19 onset. Urine L-FABP levels (a upper panel) and serum IL-6 levels (b lower panel) are shown using all cases from NCGM; L-FABP, 228 cases and IL-6, 60 cases. The thick maroon line represents the mean of severe cases. The thick blue line denotes the mean of moderate and mild cases. A wider space between the two lines (maroon and blue), represents a greater likelihood of discriminating severe cases. Mixed-effect model was used to compare L-FABP and IL-6. The slope of L-FABP becomes − 0.03 and that of IL-6 − 0.029 as time passes from onset, indicating that the value of both L-FABP and IL-6 decreases overtime. In severe cases, the value of L-FABP tends to be high soon after the onset of symptoms, and to remain high until at least 15th day. Regarding groups, there is a significant difference in L-FABP to discriminate severe cases (p < 0.0001), but IL-6 was p = 0.344 and no significance. This suggest that L-FABP is more suitable to discriminate severe cases

Similar articles

Cited by

References

    1. Adjei S, Hong K, Molinari N-AM, et al. Mortality risk among patients hospitalized primarily for COVID-19 during the omicron and delta variant pandemic periods—United States, April 2020–June 2022. MMWR. 2022;71:1182–1189. - PMC - PubMed
    1. Katella K (2023) Omicron delta alpha and more: What to know about the coronavirus variants. Yale Medicine https://www.yalemedicine.org/news/covid-19-variants-of-concernomicronhttps://www.yalemedicine.org/news/covid-19-variants-of-concern-o
    1. COVID Data Tracker by CDC: https://covid.cdc.gov/covid-data-tracker/#hospitalizations-severity.
    1. French G, Hulse M, Nguyen D, et al. Impact of hospital strain on excess deaths during the COVID-19 pandemic—United States, July 2020–July 2021. MMWR. 2021;70:1613–1616. - PMC - PubMed
    1. Loannides KLH, Dekker AM, Shin ME, Schriger DL. Ambulances required to relieve overcapacity hospitals: a novel measure of hospital strain during the COVID-19 pandemic in the United States. Ann Emerg Med. 2022;80:301–313. doi: 10.1016/j.annemergmed.2022.05.036. - DOI - PMC - PubMed

Supplementary concepts