

A Population Pharmacokinetic Analysis of L-Glutamine Exposure in Patients with Sickle Cell Disease: Evaluation of Dose and Food Effects
- PMID: 38401036
- PMCID: PMC10954986
- DOI: 10.1007/s40262-024-01349-4
A Population Pharmacokinetic Analysis of L-Glutamine Exposure in Patients with Sickle Cell Disease: Evaluation of Dose and Food Effects
Abstract
Background and objective: L-Glutamine is a treatment for children and adults with sickle cell disease. A comprehensive evaluation of the pharmacokinetics of L-glutamine in sickle cell disease has not been conducted. We aimed to assess the effects of long-term dosing, multiple dose levels, and food intake on L-glutamine exposure in patients with sickle cell disease compared to normal participants.
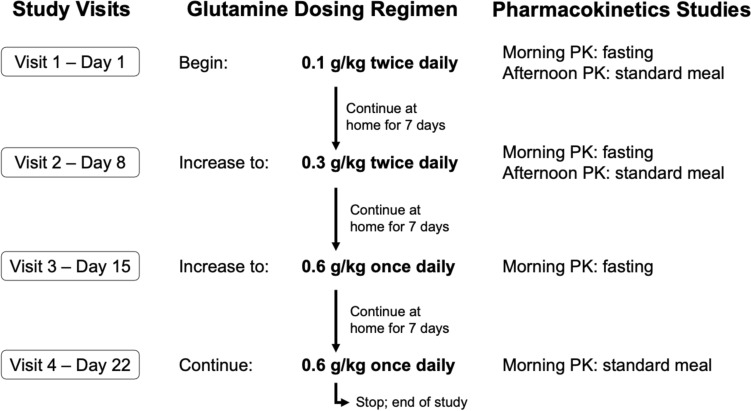
Methods: We conducted an open-label dose-ascending trial of L-glutamine in pediatric and adult participants with sickle cell disease (N = 8) and adult healthy volunteers (N = 4), providing a total of 400 plasma L-glutamine concentrations. Each participant received three ascending oral doses (0.1 and 0.3 g/kg twice daily and 0.6 g/kg once daily) over 3 weeks. Plasma L-glutamine concentrations were quantified using ion exchange chromatography. Both a non-compartmental pharmacokinetic analysis and a population pharmacokinetic analysis were performed.
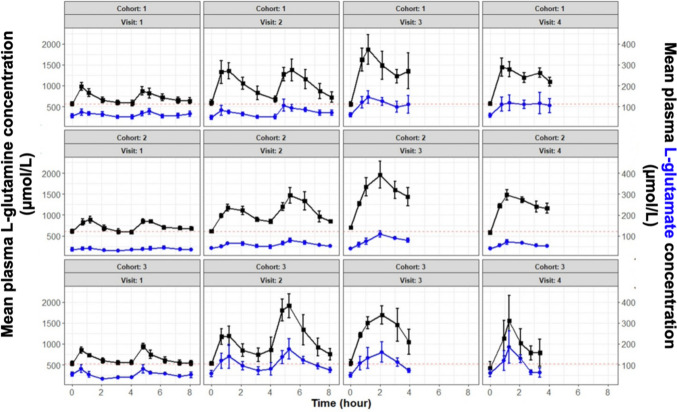
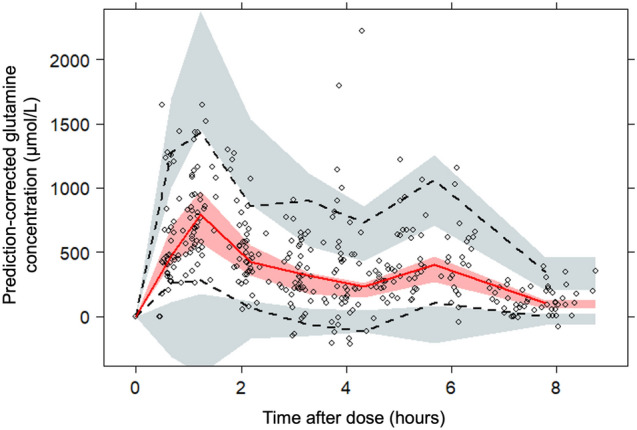
Results: L-glutamine had rapid absorption and elimination, and there was no significant change in the baseline (pre-dose) L-glutamine concentration throughout the study, indicating no drug accumulation. Pharmacokinetics was best described by a one-compartment model with first-order kinetics. The dose-normalized peak concentration decreased with dose escalation, indicating the capacity-limited non-linear pharmacokinetics of oral L-glutamine. A covariate analysis showed that baseline L-glutamine concentrations correlated negatively with glutamine clearance, whereas dose positively correlated with volume of distribution. Food intake did not significantly affect glutamine clearance, indicating that L-glutamine can be taken with or without food.
Conclusions: We report the first pharmacokinetic study of multiple-dose, long-term oral L-glutamine therapy and the first population pharmacokinetic analysis of L-glutamine for sickle cell disease. These findings may permit optimized dosing of L-glutamine for patients with sickle cell disease to maximize treatment benefits.
Clinical trial registration: This trial is registered at ClinicalTrials.gov (NCT04684381).
© 2024. The Author(s).
Conflict of interest statement
Alina Sadaf, Min Dong, Amanda Pfeiffer, Teresa Latham, Theodosia Kalfa, Alexander A. Vinks, Russell E. Ware, and Charles T. Quinn have no conflicts of interest that are directly relevant to the content of this article.
Figures

Similar articles
-
A pharmacokinetic-pharmacodynamic analysis of l-glutamine for the treatment of sickle cell disease: Implications for understanding the mechanism of action and evaluating response to therapy.Br J Haematol. 2024 Sep;205(3):1147-1158. doi: 10.1111/bjh.19632. Epub 2024 Jul 8. Br J Haematol. 2024. PMID: 38977270
-
Development of a pharmacokinetic-guided dose individualization strategy for hydroxyurea treatment in children with sickle cell anaemia.Br J Clin Pharmacol. 2016 Apr;81(4):742-52. doi: 10.1111/bcp.12851. Epub 2016 Feb 5. Br J Clin Pharmacol. 2016. PMID: 26615061 Free PMC article.
-
A Phase 3 Trial of l-Glutamine in Sickle Cell Disease.N Engl J Med. 2018 Jul 19;379(3):226-235. doi: 10.1056/NEJMoa1715971. N Engl J Med. 2018. PMID: 30021096 Clinical Trial.
-
Lopinavir/ritonavir: a review of its use in the management of HIV infection.Drugs. 2003;63(8):769-802. doi: 10.2165/00003495-200363080-00004. Drugs. 2003. PMID: 12662125 Review.
-
L-glutamine for sickle cell disease: Knight or pawn?Exp Biol Med (Maywood). 2020 Jan;245(2):146-154. doi: 10.1177/1535370219900637. Epub 2020 Jan 27. Exp Biol Med (Maywood). 2020. PMID: 31985279 Free PMC article. Review.
Cited by
-
Pharmacokinetics-Pharmacodynamics Modeling for Evaluating Drug-Drug Interactions in Polypharmacy: Development and Challenges.Clin Pharmacokinet. 2024 Jul;63(7):919-944. doi: 10.1007/s40262-024-01391-2. Epub 2024 Jun 18. Clin Pharmacokinet. 2024. PMID: 38888813 Review.
References
Publication types
MeSH terms
Substances
Associated data
LinkOut - more resources
Full Text Sources
Medical
