. 2024 Feb 15;45(3):e26590.
doi: 10.1002/hbm.26590.

Working memory signals in early visual cortex are present in weak and strong imagers

Affiliations

Working memory signals in early visual cortex are present in weak and strong imagers

Simon Weber et al. Hum Brain Mapp. .

Abstract

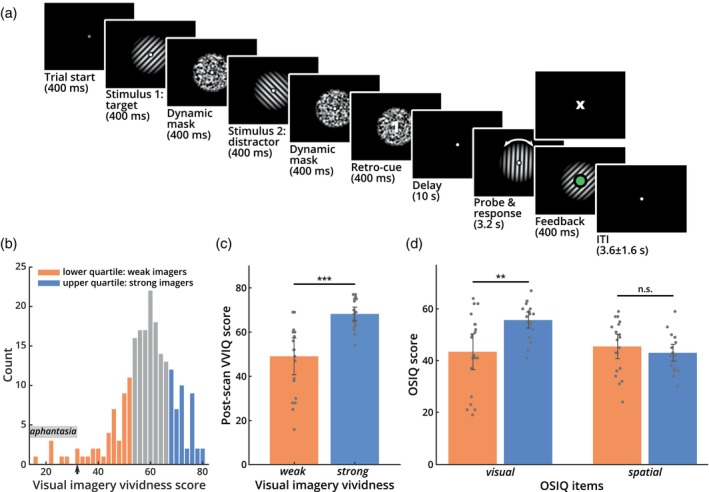
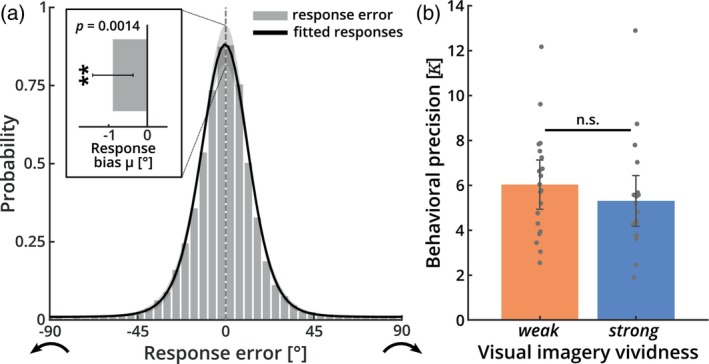
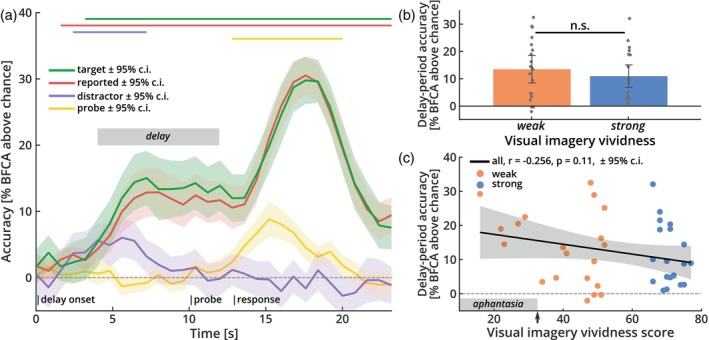
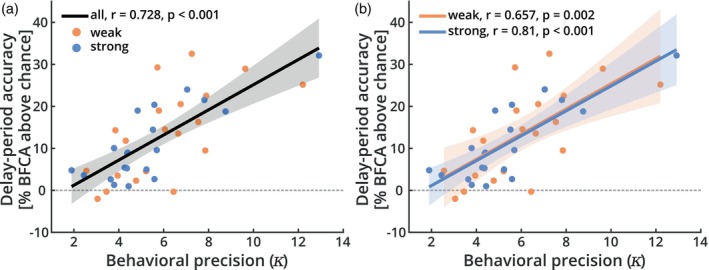
It has been suggested that visual images are memorized across brief periods of time by vividly imagining them as if they were still there. In line with this, the contents of both working memory and visual imagery are known to be encoded already in early visual cortex. If these signals in early visual areas were indeed to reflect a combined imagery and memory code, one would predict them to be weaker for individuals with reduced visual imagery vividness. Here, we systematically investigated this question in two groups of participants. Strong and weak imagers were asked to remember images across brief delay periods. We were able to reliably reconstruct the memorized stimuli from early visual cortex during the delay. Importantly, in contrast to the prediction, the quality of reconstruction was equally accurate for both strong and weak imagers. The decodable information also closely reflected behavioral precision in both groups, suggesting it could contribute to behavioral performance, even in the extreme case of completely aphantasic individuals. Our data thus suggest that working memory signals in early visual cortex can be present even in the (near) absence of phenomenal imagery.

Keywords: early visual cortex; individual differences; multivariate decoding; visual imagery; working memory.


Conflict of interest statement

The authors declare no conflicts of interest.

Figures

FIGURE 1
FIGURE 1
Experimental task and questionnaire data. (a) Sequence of events in one trial of the experiment. In each trial, participants were successively presented with two orientation stimuli, each followed by a dynamic noise mask. Orientations were drawn from a set of 40 discrete, equally spaced orientations between 0° and 180°. The stimuli were followed by a numeric retro‐cue (“1” or “2”), indicating which one of them was to be used for the subsequent delayed‐estimation task (target), and which could be dropped from memory (distractor). The orientation of the cued target grating had to be maintained for a 10‐s delay. After the delay, a probe grating appeared, which had to be adjusted using two buttons and then confirmed via an additional button press. Subsequently, visual feedback was provided to indicate whether a response was given in time (by turning the fixation point green, lower panel) or missed (by displaying a small “X” at the end of the response period if no response was given in time, upper panel). Cue and feedback are enlarged in this illustration for better visibility. (b) Distribution of the scores in an online visual imagery questionnaire (VVIQ, see Section 2) that was used for recruitment. Subjects from the upper (blue) versus lower (orange) quartiles of the distribution were recruited for the strong and weak imagery vividness groups, respectively. The small arrow on the x‐axis points to the aphantasia cutoff. (c) Questionnaire scores of the post‐scan (repeated) VVIQ for weak and strong imagers, as defined by the recruitment scores. The post‐scan scores of the weak imagery group were significantly lower than those for the strong imagery group, indicating that the groups were consistent across the study and repeated testing (t (38) = −5.086, p < .001, two‐tailed; error bars: 95% confidence intervals). (d) Results for the visual and spatial items from the OSIQ. Scores for the visual items were significantly lower for weak imagers (t (38) = −3.338, p = .002, two‐tailed). Scores for the spatial items did not differ between groups (t (38) = 0.895, p = .377, two‐tailed; error bars: 95% confidence intervals), as expected from previous work (Bainbridge et al., ; Keogh & Pearson, 2018). OSIQ, Object Spatial Imagery Questionnaire.
FIGURE 2
FIGURE 2
Behavioral results. (a) Histogram of deviations between the reported and the true orientation of the target stimuli (gray bars) and a model fit of behavioral responses across all subjects (black line). For this, the responses were modeled using a von Mises mixture model for detections (responses to target orientations, assumed to follow a von Mises distribution with mean 0° plus bias μ and behavioral precision 𝜅1), swap errors (false responses to distractor orientations, following the same assumptions as detections) and guesses (assumed to follow a continuous uniform distribution between −90° and +90°). The model estimated individual probabilities for each of these three event classes (resulting in mixture coefficients, r 1, r 2, and r 3, respectively). The estimated parameters indicate that participants accurately performed the task: they correctly responded to the target direction in around 95% of trials (r 1 = 0.947 ± 0.063). Across participants, responses were precise (𝜅1 = 5.673 ± 2.377), with a small but significant bias to respond anti‐clockwise of the target (inset; μ = −0.889 ± 1.635°; t (39) = −3.437, p = .0014, two‐tailed; error bar: 95% confidence interval). See Figure S1 for details on the other estimated parameters. (b) Behavioral precision (𝜅1) for strong and weak imagers separately. Behavioral precision did not significantly differ between groups (error bars: 95% confidence intervals).
FIGURE 3
FIGURE 3
Orientation reconstruction from early visual cortex. (a) Reconstruction performance for orientations based on brain signals from early visual areas V1–V3. The y‐axis plots the accuracy (BFCA, see Section 2), across time for target (green), reported (red), distractor (purple), and probe (yellow) orientations. The horizontal lines above the graph indicate time periods where this reconstruction was significantly above chance (permutation‐based cluster‐mass statistic, see Section 2). The target orientation (green) could be reconstructed above chance‐level throughout the delay and report periods (cluster‐p < .001). Reconstruction of the reported orientation (red) followed a highly similar pattern (cluster‐p < .001). The distractor orientation (purple) could only be reconstructed early in the trial (cluster‐p < .001), before falling back to baseline. Reconstruction of the adjustable probe orientation (yellow) was only possible late in the trial (cluster‐p < .001), after it had been presented (shaded areas: 95% confidence intervals). The gray box marks the preregistered delay‐period time window used for subsequent analyses. (b) Target reconstruction performance for strong and weak imagers separately, pooled across the preregistered delay‐period (gray bar in (a)). Delay‐period decoding accuracy did not differ between weak and strong imagers (t (38) = 0.821, p = .417, two‐tailed; error bars: 95% confidence intervals). (c) Detailed correlation between delay‐period accuracy (BFCA) and visual imagery score. There was no significant correlation between the strength of delay‐period representations and imagery vividness even when using the fully graded imagery scores (shaded area: 95% confidence interval). Neural information during the delay‐period was significantly above chance‐level even for aphantasic individuals with a visual imagery score below 32 (gray bar at x‐axis; t (4) = 8.758, p < .001, one‐tailed, E.A.). The arrow on the x‐axis points to the aphantasia cutoff. The pattern of results depicted in (b) and (c) was identical for V1, V2, and V3 ROIs separately (E.A.). BFCA, balanced feature‐continuous accuracy.
FIGURE 4
FIGURE 4
Behavioral precision versus decodable neural information from early visual cortex. Correlation between the behavioral precision (kappa, 𝜅1) in the task and the accuracy of brain‐based reconstruction. The strength of delay‐period representations was highly predictable of behavioral precision, both (a) across all participants and (b) within strong and weak imagery vividness groups. Shaded areas indicate 95% confidence intervals.

Similar articles

Cited by

References

    1. Albers, A. M. , Kok, P. , Toni, I. , Dijkerman, H. C. , & de Lange, F. P. (2013). Shared representations for working memory and mental imagery in early visual cortex. Current Biology, 23(15), 1427–1431. 10.1016/j.cub.2013.05.065 - DOI - PubMed
    1. Amedi, A. , Malach, R. , & Pascual‐Leone, A. (2005). Negative BOLD differentiates visual imagery and perception. Neuron, 48(5), 859–872. 10.1016/j.neuron.2005.10.032 - DOI - PubMed
    1. Bae, G. , & Luck, S. J. (2019). What happens to an individual visual working memory representation when it is interrupted? British Journal of Psychology, 110(2), 268–287. 10.1111/bjop.12339 - DOI - PMC - PubMed
    1. Bae, G.‐Y. , & Luck, S. J. (2018). Dissociable decoding of spatial attention and working memory from EEG oscillations and sustained potentials. The Journal of Neuroscience, 38(2), 409–422. 10.1523/JNEUROSCI.2860-17.2017 - DOI - PMC - PubMed
    1. Bainbridge, W. A. , Pounder, Z. , Eardley, A. F. , & Baker, C. I. (2021). Quantifying aphantasia through drawing: Those without visual imagery show deficits in object but not spatial memory. Cortex, 135, 159–172. 10.1016/j.cortex.2020.11.014 - DOI - PMC - PubMed