. 2024 May:71:103088.
doi: 10.1016/j.redox.2024.103088. Epub 2024 Feb 15.

Inhibition of ALK3-mediated signalling pathway protects against acetaminophen-induced liver injury

Affiliations

Inhibition of ALK3-mediated signalling pathway protects against acetaminophen-induced liver injury

Patricia Marañón et al. Redox Biol. 2024 May.

Abstract

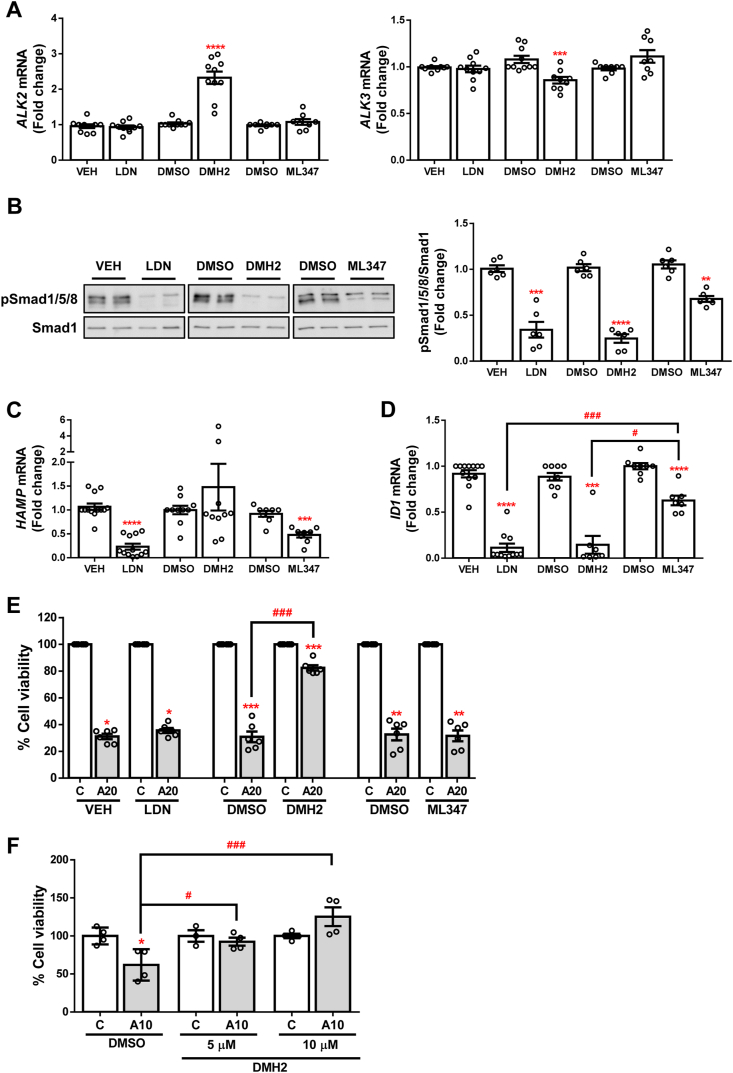
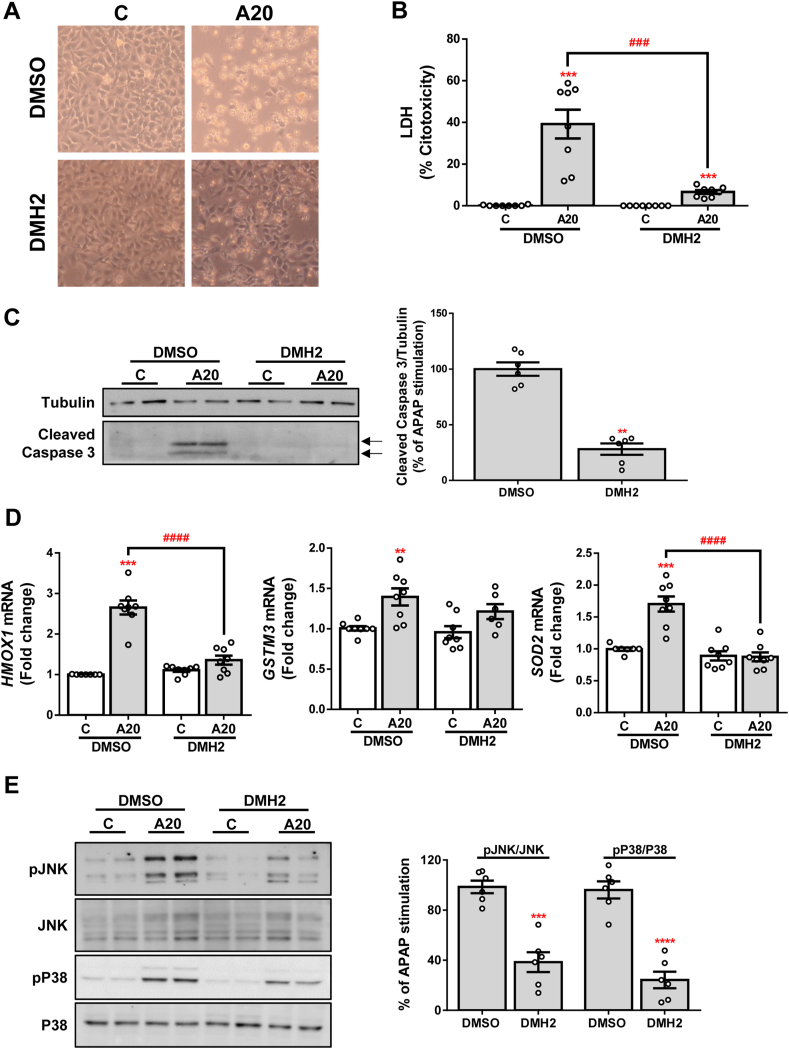
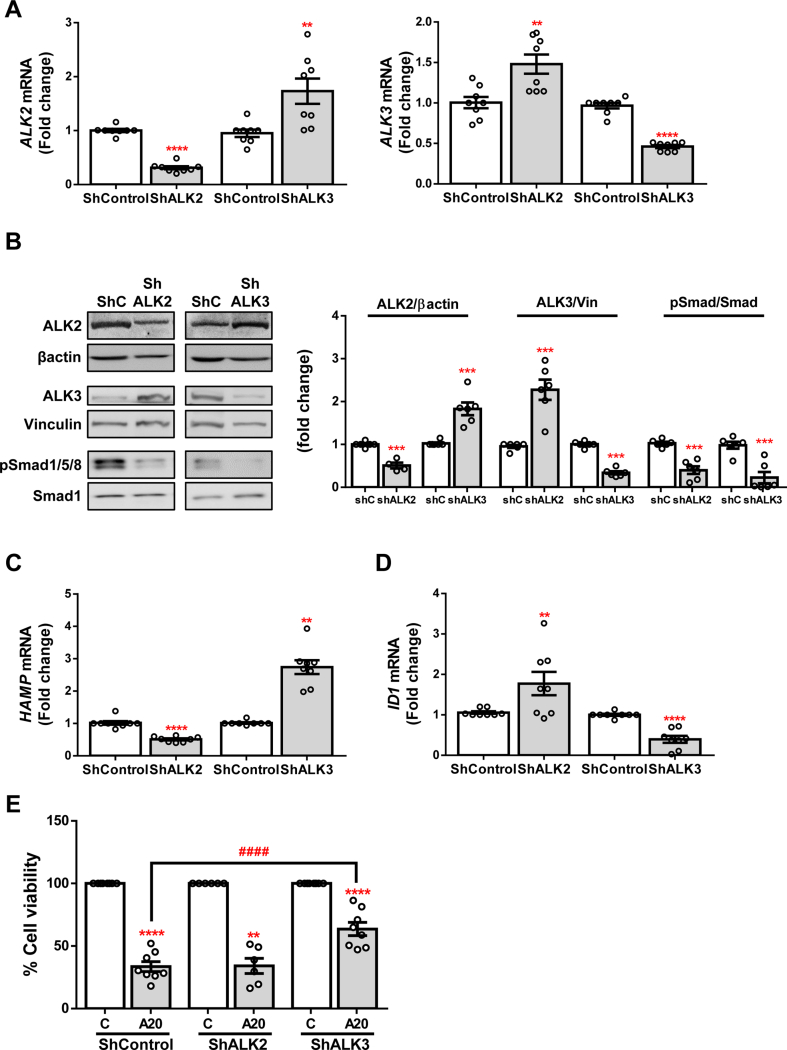
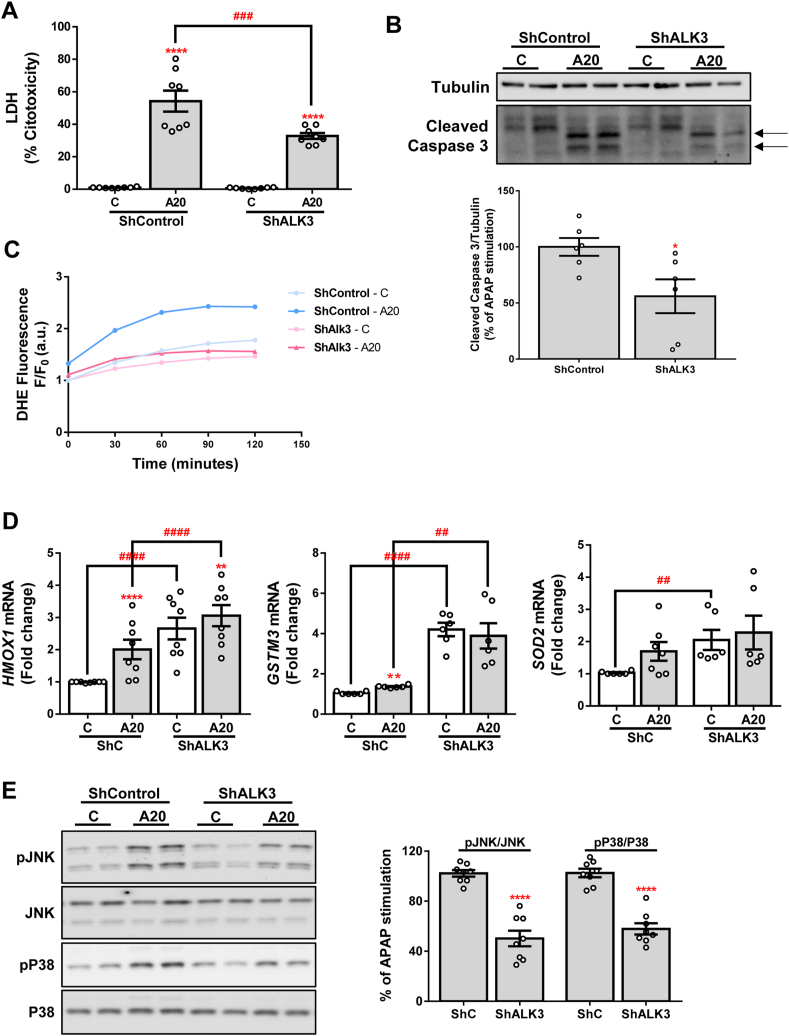
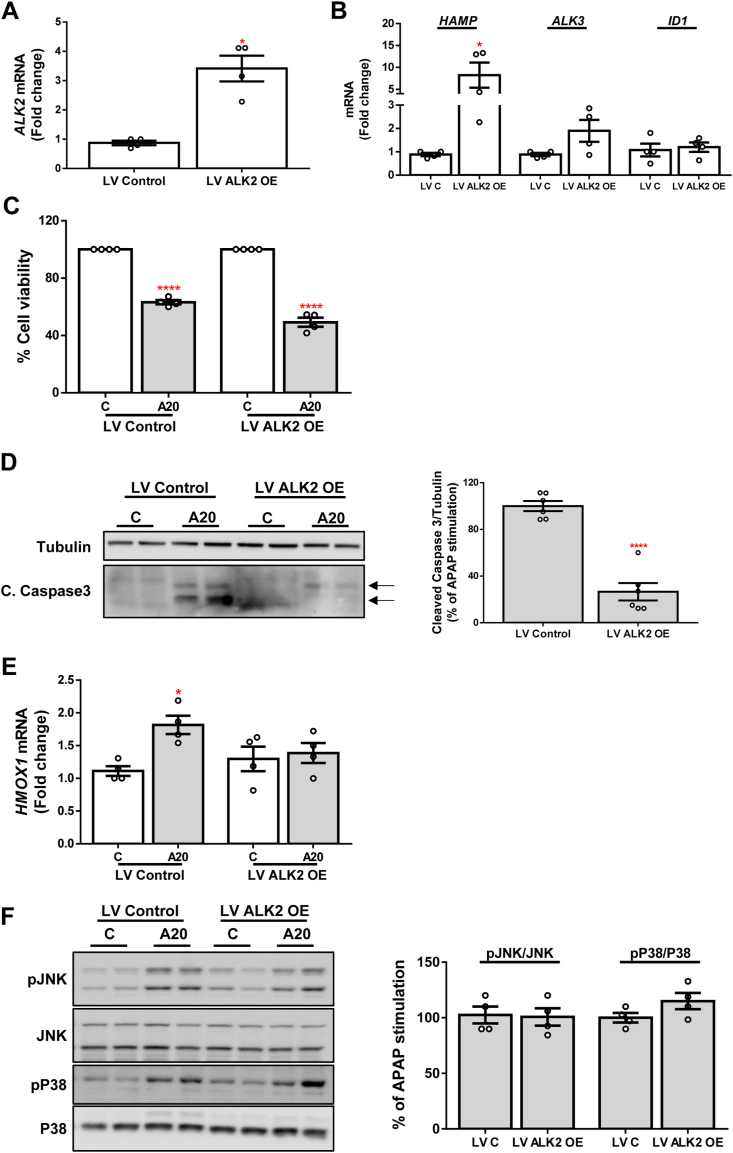
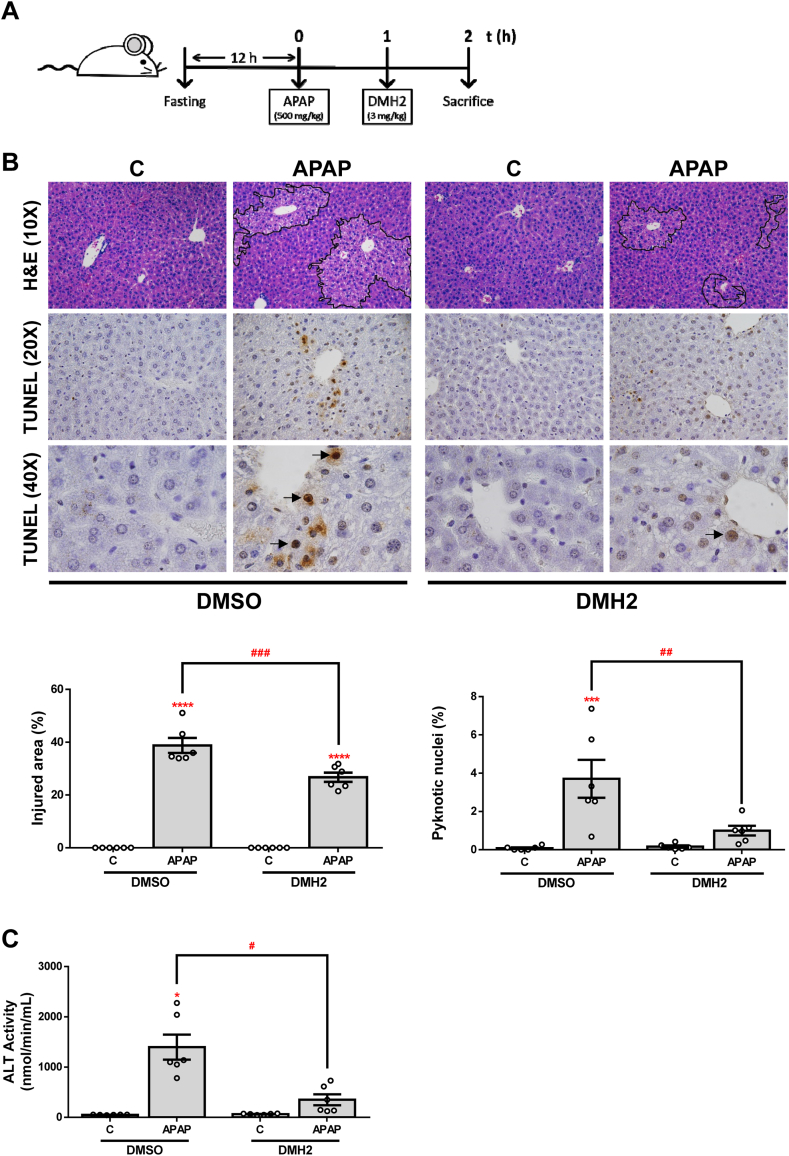
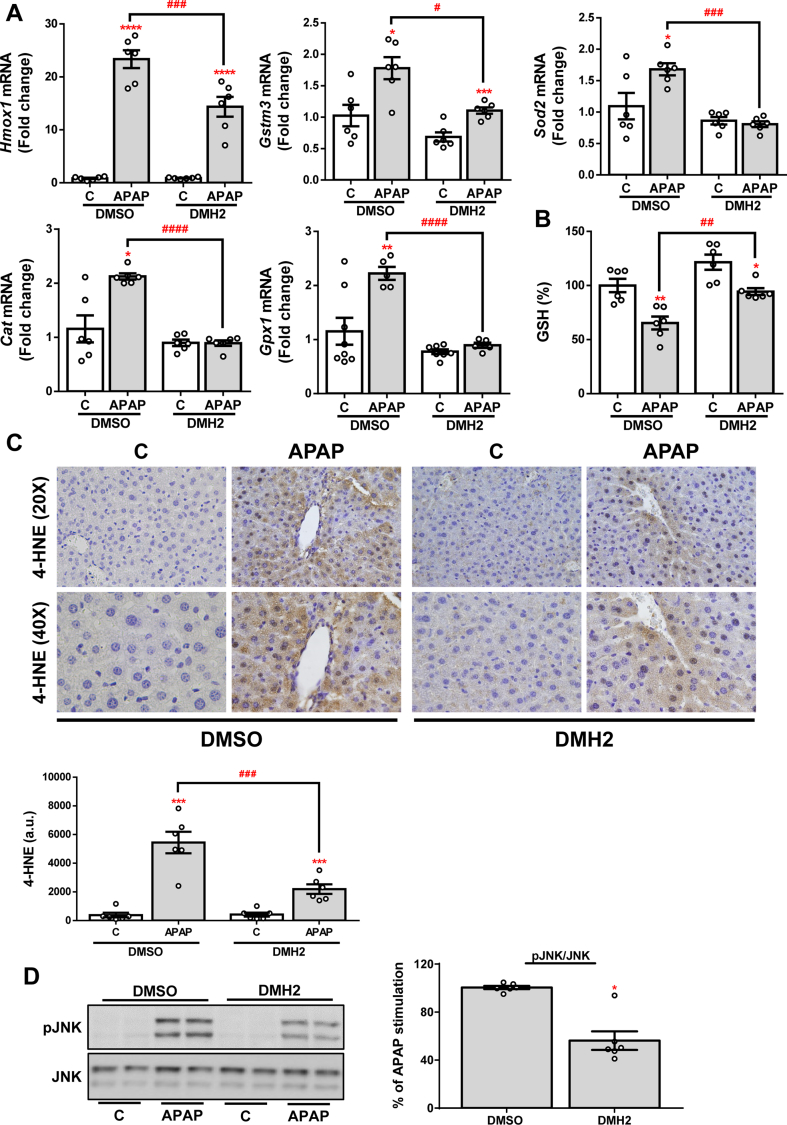
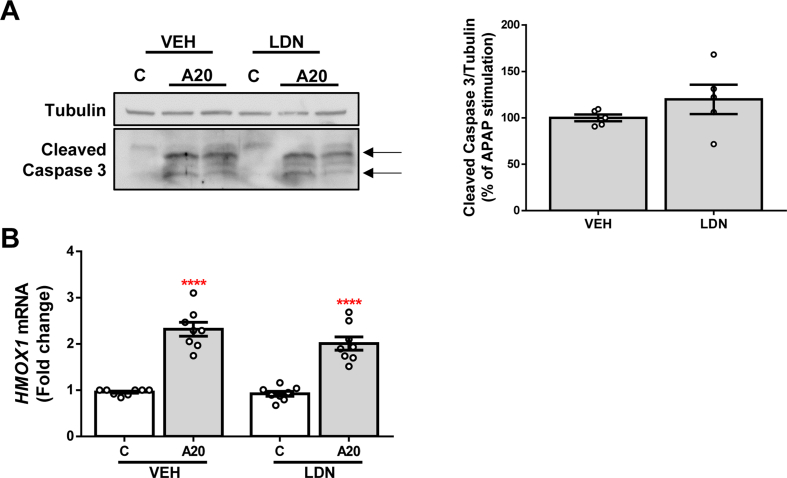
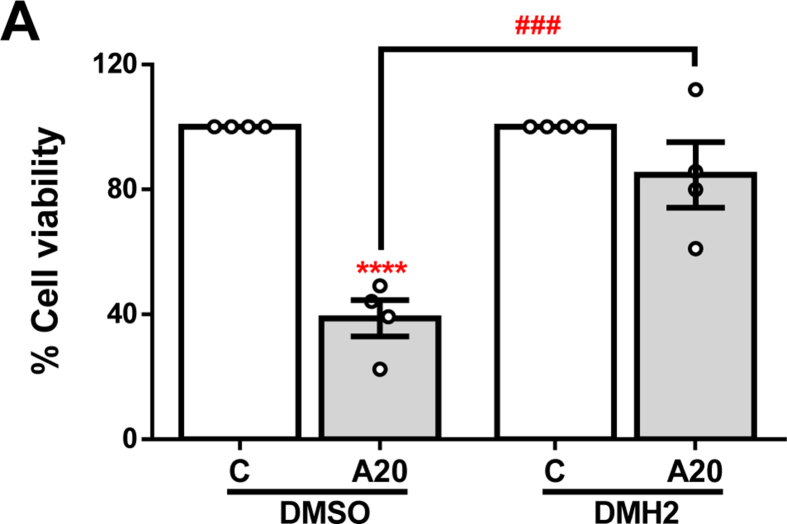
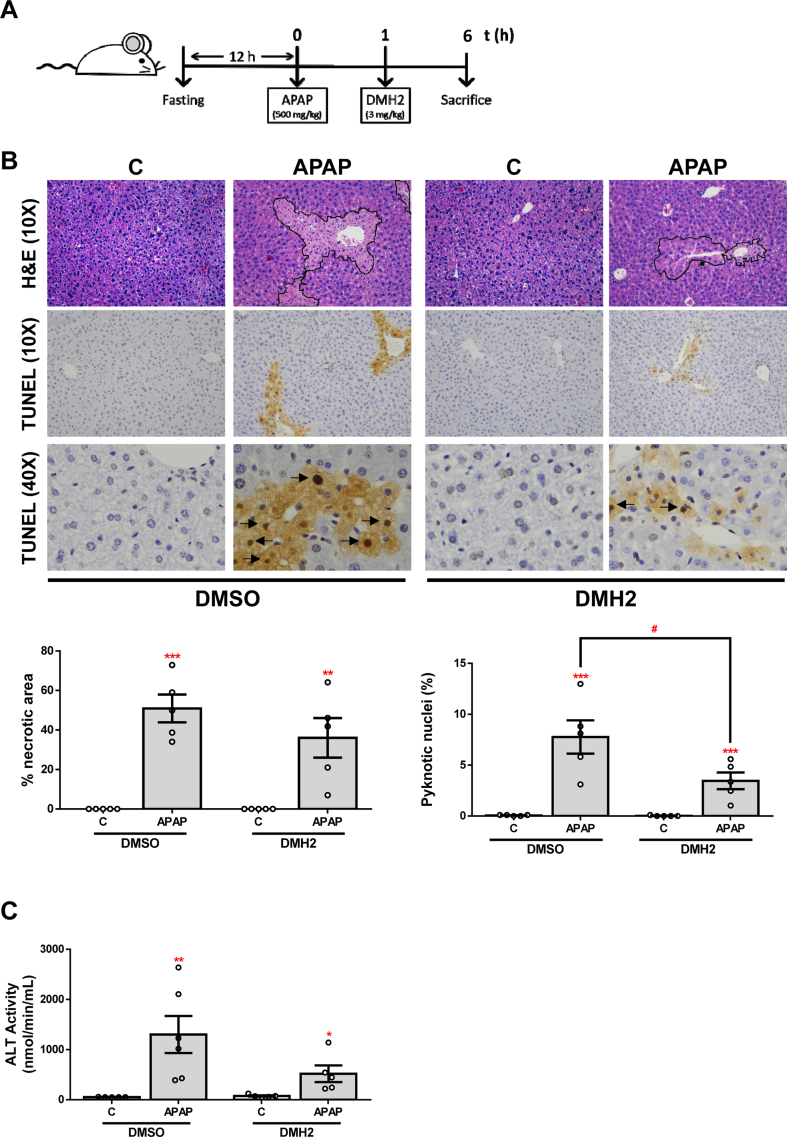
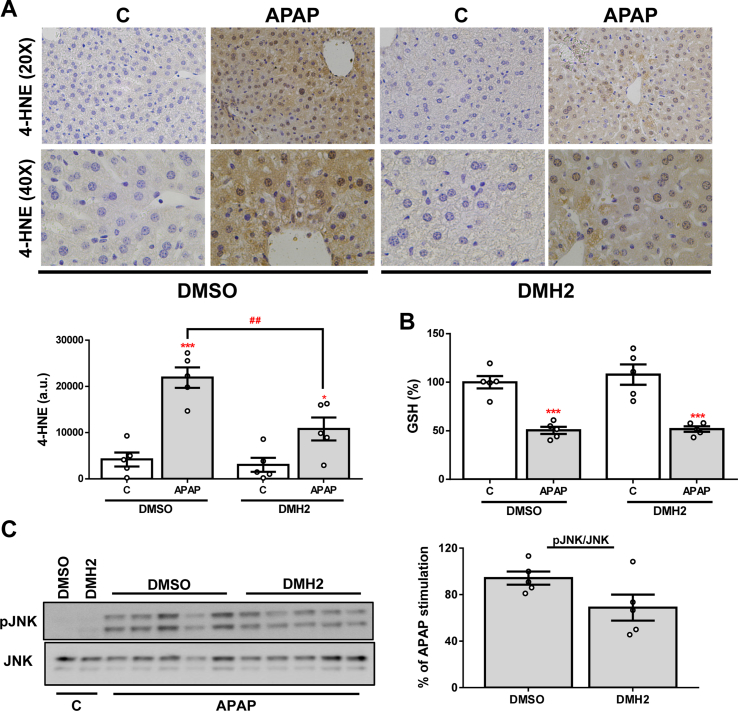
Acetaminophen (APAP)-induced liver injury is one of the most prevalent causes of acute liver failure (ALF). We assessed the role of the bone morphogenetic protein (BMP) type I receptors ALK2 and ALK3 in APAP-induced hepatotoxicity. The molecular mechanisms that regulate the balance between cell death and survival and the response to oxidative stress induced by APAP was assessed in cultured human hepatocyte-derived (Huh7) cells treated with pharmacological inhibitors of ALK receptors and with modulated expression of ALK2 or ALK3 by lentiviral infection, and in a mouse model of APAP-induced hepatotoxicity. Inhibition of ALK3 signalling with the pharmacological inhibitor DMH2, or by silencing of ALK3, showed a decreased cell death both by necrosis and apoptosis after APAP treatment. Also, upon APAP challenge, ROS generation was ameliorated and, thus, ROS-mediated JNK and P38 MAPK phosphorylation was reduced in ALK3-inhibited cells compared to control cells. These results were also observed in an experimental model of APAP-induced ALF in which post-treatment with DMH2 after APAP administration significantly reduced liver tissue damage, apoptosis and oxidative stress. This study shows the protective effect of ALK3 receptor inhibition against APAP-induced hepatotoxicity. Furthermore, findings obtained from the animal model suggest that BMP signalling might be a new pharmacological target for the treatment of ALF.

Keywords: ALK3; Acetaminophen; Acute liver failure; Bone morphogenetic proteins; DMH2; Drug induced liver injury.


Conflict of interest statement

Declaration of competing interest None'.

Figures

Fig. 1
Fig. 1
Pharmacological inhibition of BMP type I receptors ALK2 and ALK3. A. mRNA levels of ALK2 and ALK3 determined by RT-qPCR and normalized to 36B4 gene expression. Data are expressed as fold increase relative to control condition (vehicle; VEH or DMSO, 1) and presented as mean ± SEM. B. Representative blots with the indicated antibodies and the corresponding quantification. Data are expressed as fold change relative to the control condition (vehicle; VEH or DMSO, 1) and presented as mean ± SEM. C – D.HAMP and ID1 mRNA levels determined by RT-qPCR and normalized to 36B4 gene expression. Data are expressed as fold increase relative to the control condition (vehicle; VEH or DMSO, 1) and presented as mean ± SEM. Experimental conditions: Huh7 treated with the inhibitors LDN-193189 (LDN) (500 nM), DMH2 (10 μM) or ML347 (150 nM) for 16 h (n ≥ 3 independent experiments). **p < 0.01, ***p < 0.005 and ****p < 0.0001, LDN vs. VEH, or DMH2 or ML347 vs. DMSO; #p < 0.05 and ###p < 0.005, ML347 vs. DMH2 or LDN. E – F. Cell viability determined by crystal violet staining. Data are represented as percentage relative to the control group (vehicle; VEH or DMSO, 100%) and presented as mean ± SEM. Experimental conditions: (E) Huh7 treated with the inhibitors LDN-193189 (LDN) (500 nM), DMH2 (10 μM) or ML347 (150 nM) 1 h prior to APAP (20 mM, A20) stimulation for 16 h (n ≥ 3 independent experiments). (F) Primary mouse hepatocytes treated with the inhibitor DMH2 (5 or 10 μM) 1 h prior to APAP (10 mM, A10) stimulation for 16 h (n = 2 independent experiments performed by duplicate). *p < 0.05, **p < 0.01 and ***p < 0.005, A10 or A20 vs. C; #p < 0.05 and ###p < 0.005, A10/20-DMH2 vs. A10/20-DMSO. (For interpretation of the references to color in this figure legend, the reader is referred to the Web version of this article.)
Fig. 2
Fig. 2
Pharmacological inhibition of ALK3 with DMH2 protects against APAP-induced hepatotoxicity. A. Representative phase-contrast images of Huh7 cells treated with the inhibitor DMH2 (10 μM) 1 h prior to APAP (20 mM, A20) stimulation for 16 h. B. Cytotoxicity determined by lactate dehydrogenase (LDH) release. Data are presented as percentage relative to the positive control (100%) and presented as mean ± SEM. C. Representative blots with the indicated antibodies and the corresponding quantification. Data are expressed as percentage relative to the control group (DMSO, 100%) and presented as mean ± SEM. D. mRNA levels of HMOX1, GSTM3 and SOD2 determined by RT-qPCR and normalized to 36B4 gene expression. Data are expressed as fold increase relative to the control condition (C-DMSO, 1) and presented as mean ± SEM. E. Representative blots with the indicated antibodies and the corresponding quantification. Data are expressed as percentage relative to the control group (DMSO, 100%) and presented as mean ± SEM. Experimental conditions: Huh7 treated with the inhibitor DMH2 (10 μM) 1 h prior to APAP (20 mM, A20) stimulation for 6 (E) or 16 (A–D) hours (n ≥ 3 independent experiments). **p < 0.01, ***p < 0.005 and ****p < 0.0001, A20 vs. C, or DMH2 vs. DMSO; ###p < 0.005 and ####p < 0.0001, A20-DMH2 vs. A20-DMSO.
Fig. 3
Fig. 3
Effect of silencing of BMP type I receptors ALK3 and ALK2 on cellular viability on Huh7 human hepatocytes. A. mRNA levels of ALK2 (left) and ALK3 (right) determined by RT-qPCR and normalized to 36B4 gene expression. B. Representative blots with the indicated antibodies and the corresponding quantification. Data are expressed as fold increase relative to the control condition (ShControl, 1) and presented as mean ± SEM. C - D. mRNA levels of HAMP and ID1, respectively, determined by RT-qPCR and normalized to 36B4 gene expression. Data are expressed as fold increase relative to the control condition (ShControl, 1) and presented as mean ± SEM. Experimental conditions: Huh7 silenced stable lines ShALK2 and ShALK3 and their control ShControl (ShC) treated (n ≥ 3 independent experiments). **p < 0.01, ***p < 0.005 and ****p < 0.0001, ShALK2 or ShALK3 vs. ShC. E. Cell viability determined by crystal violet staining. Data are represented as percentage relative to control group (C, 100%) and presented as mean ± SEM. Experimental conditions: Huh7 silenced stable lines ShALK2 and ShALK3 and their control ShControl (ShC) treated with APAP (20 mM, A20) for 16 h (n ≥ 3 independent experiments). **p < 0.01 and ****p < 0.0001, A20 vs. C; ####p < 0.0001, A20-ShALK3 vs. A20-ShC. (For interpretation of the references to color in this figure legend, the reader is referred to the Web version of this article.)
Fig. 4
Fig. 4
Silencing of ALK3 protects against APAP-induced cell toxicity. A. Cytotoxicity determined by lactate dehydrogenase (LDH) release. Data are presented as percentage relative to the positive control (100%). B. Representative blots with the indicated antibodies and the corresponding quantification. Data are expressed as percentage relative to the control group (ShControl, 100%) and presented as mean ± SEM. C. ROS production detected with DHE probe represented as DHE fluorescence F/F0 (a.u.) through exposure to APAP during 2 h. D. mRNA levels of HMOX1, GSTM3 and SOD2 determined by RT-qPCR and normalized to 36B4 gene expression. Data are expressed as fold increase relative to the control condition (ShControl 1) and presented as mean ± SEM. E. Representative blots with the indicated antibodies and the corresponding quantifications. Data are expressed as percentage relative to control group (ShControl, 100%) and presented as mean ± SEM. Experimental conditions: Huh7 silenced stable line ShALK3 and its control ShControl (ShC) treated with APAP 20 mM (A20) for 2 (C), 6 (E) or 16 (A, B, D) hours (n ≥ 3 independent experiments). *p < 0.05, **p < 0.01 and ****p < 0.0001, A20 vs. C, or ShALK3 vs. ShC; #p < 0.05, ###p < 0.005 and ####p < 0.001, C-ShALK3 vs. C-ShC or A20-ShALK3 vs. A20-ShC.
Fig. 5
Fig. 5
Antiapoptotic effect of ALK2 over-expression. A - B. mRNA levels of ALK2, HAMP, ALK3 and ID1 determined by RT-qPCR and normalized to 36B4 gene expression. Data are expressed as fold increase relative to control condition (LV Control, 1) and presented as mean ± SEM. C. Cell viability determined by crystal violet staining. Data are represented as percentage relative to control group (C, 100%). D. Representative blots with the indicated antibodies and the corresponding quantification. Data are expressed as percentage relative to control group (LV Control, 100%). E. mRNA levels of HMOX1 determined by RT-qPCR and normalized to 36B4 gene expression. Data are expressed as fold increase relative to control condition (C-LV Control, 1) and presented as mean ± SEM. F. Representative blots with the indicated antibodies and the corresponding quantifications. Data are expressed as percentage relative to control group (LV Control, 100%) and presented as mean ± SEM. Experimental conditions: Huh7 cell line over-expressing ALK2 (LV ALK2 OE) and their control (LV Control, LV C) treated with APAP (20 mM, A20) for 6 (F) or 16 (A–E) hours (n ≥ 3 independent experiments). *p < 0.05 and ****p < 0.0001, LV ALK2 OE vs. LV C, or A20 vs. C. (For interpretation of the references to color in this figure legend, the reader is referred to the Web version of this article.)
Fig. 6
Fig. 6
The ALK3 inhibitor DMH2 protects against liver damage in an animal model of APAP-induced acute liver failure. A.Experimental conditions: Mice i. p. injected with vehicle (DMSO) or APAP (500 mg/kg), and 1 h later treated with DMH2 or the corresponding amount of DMSO in a single dose of 3 mg/kg. Animals were sacrificed 2 h after APAP administration (n = 6 animals per group). B. Representative 10X images of H&E, and 20X and 40X images of TUNEL staining and the corresponding quantifications. Data are expressed as percentage of injured area or pyknotic nuclei, respectively and presented as mean ± SEM. C. ALT activity determination in serum samples presented as mean ± SEM. *p < 0.05, ***p < 0.005 and ****p < 0.0001, APAP vs. C; #p < 0.05, ##p < 0.01 and ###p < 0.005, APAP-DMH2 vs. APAP-DMSO.
Fig. 7
Fig. 7
DMH2 ameliorates oxidative stress in an animal model of APAP- induced acute liver failure. A. mRNA levels of Hmox1, Gstm3, Sod2, Cat and Gpx1 determined by RT-qPCR and normalized to 36b4 gene expression. Data are expressed as fold increase relative to the control condition (C-DMSO, 1) and presented as mean ± SEM. B. GSH levels. Data are expressed as percentage relative to the control group (C-DMSO, 100%) and presented as mean ± SEM. C. Representative 20X and 40X images of 4-HNE IHC in liver sections and the corresponding quantification. Data are presented as mean ± SEM and expressed as arbitrary units (a.u.). D. Representative blots with the indicated antibodies and the corresponding quantification. Data are presented as mean ± SEM and expressed as percentage relative to control group (C-DMSO, 100%). Experimental conditions: Mice i. p. Injected with vehicle (DMSO) or APAP (500 mg/kg), and 1 h later treated with DMH2 or the corresponding amount of DMSO in a single dose of 3 mg/kg. Animals were sacrificed 2 h after APAP administration (n = 6 animals per group). *p < 0.05, **p < 0.01, ***p < 0.005 and ****p < 0.0001, APAP vs. C; #p < 0.05, ##p < 0.01, ###p < 0.005 and ####p < 0.001, APAP-DMH2 vs. APAP-DMSO.
Supplementary Fig. 1
Pharmacological inhibition of ALK3 and ALK2 with LDN does not protect against APAP-induced hepatotoxicity. A. Representative blots with cleaved caspase 3 antibody and their quantification normalized with tubulin antibody as loading control. Data are expressed as percentage relative to the control group (VEH, 100%) and presented as mean ± SEM. B. mRNA levels of HMOX1 determined by RT-qPCR and normalized to 36B4 gene expression. Data are expressed as fold increase relative to control condition (C-VEH, 1) and presented as mean ± SEM. Experimental conditions: Huh7 treated with the inhibitor LDN-193189 (LDN) (500 nM) 1 h prior to APAP (20 mM, A20) stimulation for 16 h (n ≥ 3 independent experiments). ****p < 0.0001 A20vs. C.
Supplementary Fig. 2
Post-treatment of Huh7 cells with DMH2 protects against hepatotoxicity induced by APAP. A. Cell viability determined by crystal violet staining. Data are represented as percentage relative to control group (C, 100%). Experimental conditions: Huh7 treated with APAP (20 mM, A20) following with DMH2 (10 μM) treatment 1 h after APAP both maintained for 16 h (n > 3 independent experiments). ****p < 0.0001 A20vs. C; ###p < 0.005 A20-DMH2 vs. A20-DMSO.
Supplementary Fig. 3
Evaluation of DMH2 effects against APAP-induced liver damage at later time points. A. Experimental conditions: Mice i.p. Injected with vehicle (DMSO) or APAP (500 mg/kg), and 1 h later treated with DMH2 or the corresponding amount of DMSO in a single dose of 3 mg/kg. Animals were sacrificed 6 h after APAP administration (n = 5 animals per group). B. Representative 10X images of H&E, and, 10X and 40X images of TUNEL staining, and the corresponding quantifications. Data are presented as mean ± SEM and expressed as percentage of necrotic area or pyknotic nuclei, respectively. C. ALT activity determination in serum samples presented as mean ± SEM. *p < 0.05, ***p < 0.005 and ****p < 0.0001, APAP vs. C; #p < 0.05, ##p < 0.01 and ###p < 0.005, APAP-DMH2 vs. APAP-DMSO.
Supplementary Fig. 4
Evaluation of DMH2 effects against APAP-induced liver damage at later time points. A. Representative 20X and 40X images of 4-HNE IHC in liver sections and the corresponding quantification. Data are presented as mean ± SEM and expressed as arbitrary units (a.u.). B. GSH levels. Data are expressed as percentage relative to control group (C-DMSO, 100%) and presented as mean ± SEM. C. Representative blots with the indicated antibodies and the corresponding quantification. Data are presented as mean ± SEM and expressed as percentage relative to control group (C-DMSO, 100%) and presented as mean ± SEM. Experimental conditions: Mice i.p. Injected with vehicle (DMSO) or APAP (500 mg/kg), and 1 h later treated with DMH2 or the corresponding amount of DMSO in a single dose of 3 mg/kg. Animals were sacrificed 6 h after APAP administration (n = 5 animals per group). *p < 0.05 and ***p < 0.005, APAP vs. C; ##p < 0.01, APAP-DMH2 vs. APAP-DMSO.

References

    1. Lee W.M., Squires R.H., Nyberg S.L., Doo E., Hoofnagle J.H. Acute liver failure: summary of a workshop. Hepatology. 2008;47(4):1401–1415. - PMC - PubMed
    1. Lee W.M. Acetaminophen (APAP) hepatotoxicity-Isn't it time for APAP to go away? J. Hepatol. 2017;67(6):1324–1331. - PMC - PubMed
    1. Jóźwiak-Bebenista M., Nowak J.Z. Paracetamol: mechanism of action, applications and safety concern. Acta Pol. Pharm. 2014;71(1):11–23. - PubMed
    1. Pezzia C., Sanders C., Welch S., Bowling A., Lee W.M., Group A.L.F.S. Psychosocial and behavioral factors in acetaminophen-related acute liver failure and liver injury. J. Psychosom. Res. 2017;101:51–57. - PMC - PubMed
    1. Bunchorntavakul C., Reddy K.R. Acetaminophen (APAP or N-Acetyl-p-Aminophenol) and acute liver failure. Clin. Liver Dis. 2018;22(2):325–346. - PubMed

MeSH terms