Membrane mimetic-dependence of GPCR energy landscapes
- PMID: 38401537
- PMCID: PMC11069452
- DOI: 10.1016/j.str.2024.01.013
Membrane mimetic-dependence of GPCR energy landscapes
Abstract
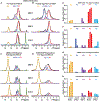
We leveraged variable-temperature 19F-NMR spectroscopy to compare the conformational equilibria of the human A2A adenosine receptor (A2AAR), a class A G protein-coupled receptor (GPCR), across a range of temperatures ranging from lower temperatures typically employed in 19F-NMR experiments to physiological temperature. A2AAR complexes with partial agonists and full agonists showed large increases in the population of a fully active conformation with increasing temperature. NMR data measured at physiological temperature were more in line with functional data. This was pronounced for complexes with partial agonists, where the population of active A2AAR was nearly undetectable at lower temperature but became evident at physiological temperature. Temperature-dependent behavior of complexes with either full or partial agonists exhibited a pronounced sensitivity to the specific membrane mimetic employed. Cellular signaling experiments correlated with the temperature-dependent conformational equilibria of A2AAR in lipid nanodiscs but not in some detergents, underscoring the importance of the membrane environment in studies of GPCR function.
Keywords: A(2A) adenosine receptor; GPCR; NMR; cellular signaling; membrane mimetics.
Copyright © 2024 Elsevier Ltd. All rights reserved.
Conflict of interest statement
Declaration of interests The authors declare no competing interests.
Figures


Update of
-
Membrane Mimetic-Dependence of GPCR Energy Landscapes.bioRxiv [Preprint]. 2023 Oct 19:2023.10.16.562552. doi: 10.1101/2023.10.16.562552. bioRxiv. 2023. Update in: Structure. 2024 May 2;32(5):523-535.e5. doi: 10.1016/j.str.2024.01.013. PMID: 37905159 Free PMC article. Updated. Preprint.
Similar articles
-
The Conformational Equilibria of a Human GPCR Compared between Lipid Vesicles and Aqueous Solutions by Integrative 19F-NMR.J Am Chem Soc. 2025 May 28;147(21):17612-17625. doi: 10.1021/jacs.4c15106. Epub 2025 May 16. J Am Chem Soc. 2025. PMID: 40377170
-
Membrane Mimetic-Dependence of GPCR Energy Landscapes.bioRxiv [Preprint]. 2023 Oct 19:2023.10.16.562552. doi: 10.1101/2023.10.16.562552. bioRxiv. 2023. Update in: Structure. 2024 May 2;32(5):523-535.e5. doi: 10.1016/j.str.2024.01.013. PMID: 37905159 Free PMC article. Updated. Preprint.
-
Activation of adenosine A2A receptor by lipids from docosahexaenoic acid revealed by NMR.Sci Adv. 2020 Mar 18;6(12):eaay8544. doi: 10.1126/sciadv.aay8544. eCollection 2020 Mar. Sci Adv. 2020. PMID: 32206717 Free PMC article.
-
Nicotine receptor partial agonists for smoking cessation.Cochrane Database Syst Rev. 2012 Apr 18;(4):CD006103. doi: 10.1002/14651858.CD006103.pub6. Cochrane Database Syst Rev. 2012. Update in: Cochrane Database Syst Rev. 2016 May 09;(5):CD006103. doi: 10.1002/14651858.CD006103.pub7. PMID: 22513936 Updated.
-
Nicotine receptor partial agonists for smoking cessation.Cochrane Database Syst Rev. 2011 Feb 16;(2):CD006103. doi: 10.1002/14651858.CD006103.pub5. Cochrane Database Syst Rev. 2011. Update in: Cochrane Database Syst Rev. 2012 Apr 18;(4):CD006103. doi: 10.1002/14651858.CD006103.pub6. PMID: 21328282 Updated.
Cited by
-
Biased activation of the vasopressin V2 receptor probed by molecular dynamics simulations, NMR and pharmacological studies.Comput Struct Biotechnol J. 2024 Oct 24;23:3784-3799. doi: 10.1016/j.csbj.2024.10.039. eCollection 2024 Dec. Comput Struct Biotechnol J. 2024. PMID: 39525085 Free PMC article.
-
Nanodiscs for the study of membrane proteins.Curr Opin Struct Biol. 2024 Aug;87:102844. doi: 10.1016/j.sbi.2024.102844. Epub 2024 May 24. Curr Opin Struct Biol. 2024. PMID: 38795563 Free PMC article. Review.
-
Functional dynamics of G protein-coupled receptors reveal new routes for drug discovery.Nat Rev Drug Discov. 2025 Apr;24(4):251-275. doi: 10.1038/s41573-024-01083-3. Epub 2025 Jan 2. Nat Rev Drug Discov. 2025. PMID: 39747671 Review.
-
The influence of lipids and biological membranes on the conformational equilibria of GPCRs: Insights from NMR spectroscopy.Curr Opin Struct Biol. 2025 Jun 27;94:103103. doi: 10.1016/j.sbi.2025.103103. Online ahead of print. Curr Opin Struct Biol. 2025. PMID: 40580801 Review.
-
The Conformational Equilibria of a Human GPCR Compared between Lipid Vesicles and Aqueous Solutions by Integrative 19F-NMR.J Am Chem Soc. 2025 May 28;147(21):17612-17625. doi: 10.1021/jacs.4c15106. Epub 2025 May 16. J Am Chem Soc. 2025. PMID: 40377170
References
-
- Kern D, and Zuiderweg ER (2003). The role of dynamics in allosteric regulation. Curr. Opin. Struct. Biol 13, 748–757. - PubMed
-
- Eisenmesser EZ, Millet O, Labeikovsky W, Korzhnev DM, Wolf-Watz M, Bosco DA, Skalicky JJ, Kay LE, and Kern D (2005). Intrinsic dynamics of an enzyme underlies catalysis. Nature 438, 117–121. - PubMed
-
- Henzler-Wildman KA, Lei M, Thai V, Kerns SJ, Karplus M, and Kern D (2007). A hierarchy of timescales in protein dynamics is linked to enzyme catalysis. Nature 450, 913–916. - PubMed
-
- Berendsen H (2000). Collective protein dynamics in relation to function. Curr. Opin. Struct. Biol 10, 165–169. - PubMed
-
- Columbus L, and Hubbell WL (2002). A new spin on protein dynamics. Trends Biochem. Sci 27, 288–295. - PubMed
Publication types
MeSH terms
Substances
Grants and funding
LinkOut - more resources
Full Text Sources
Research Materials

