. 2024 Feb 24;15(1):1705.
doi: 10.1038/s41467-024-46139-5.

NAAA-regulated lipid signaling in monocytes controls the induction of hyperalgesic priming in mice

Affiliations

NAAA-regulated lipid signaling in monocytes controls the induction of hyperalgesic priming in mice

Yannick Fotio et al. Nat Commun. .

Abstract

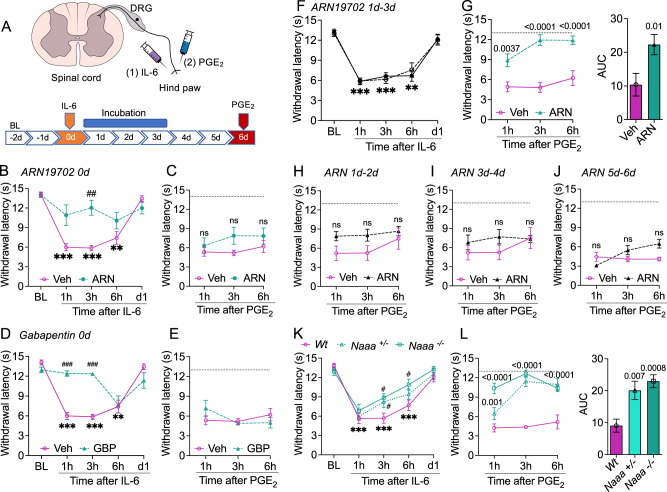
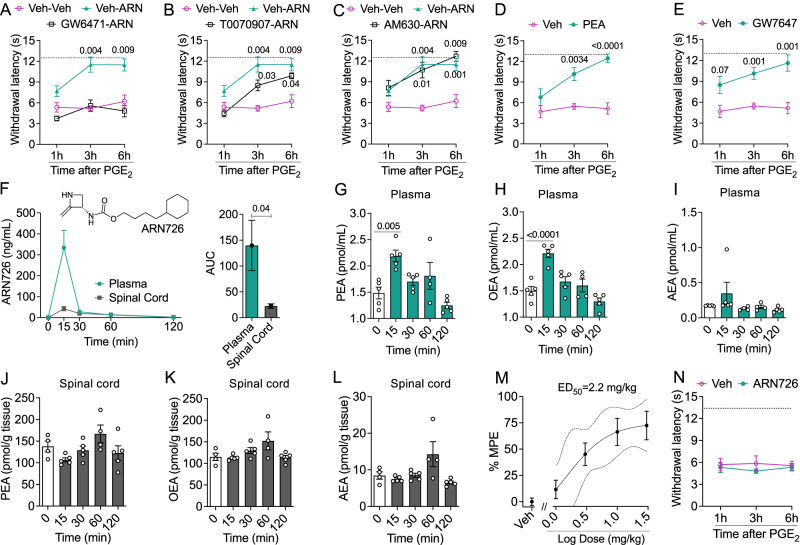
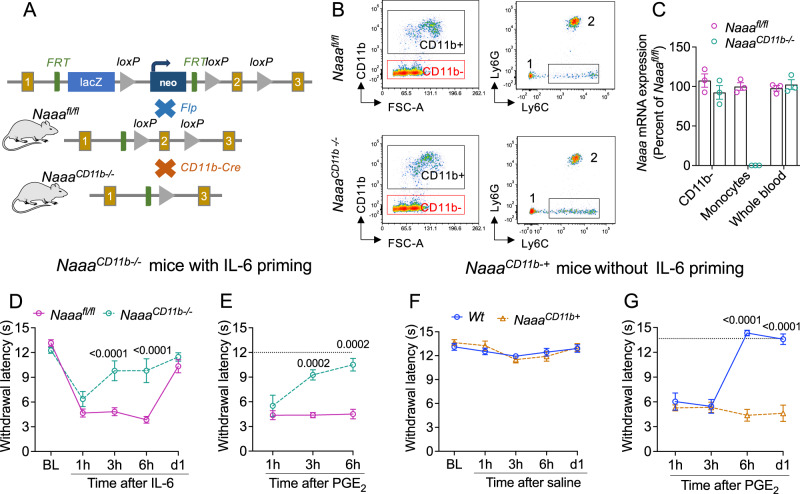
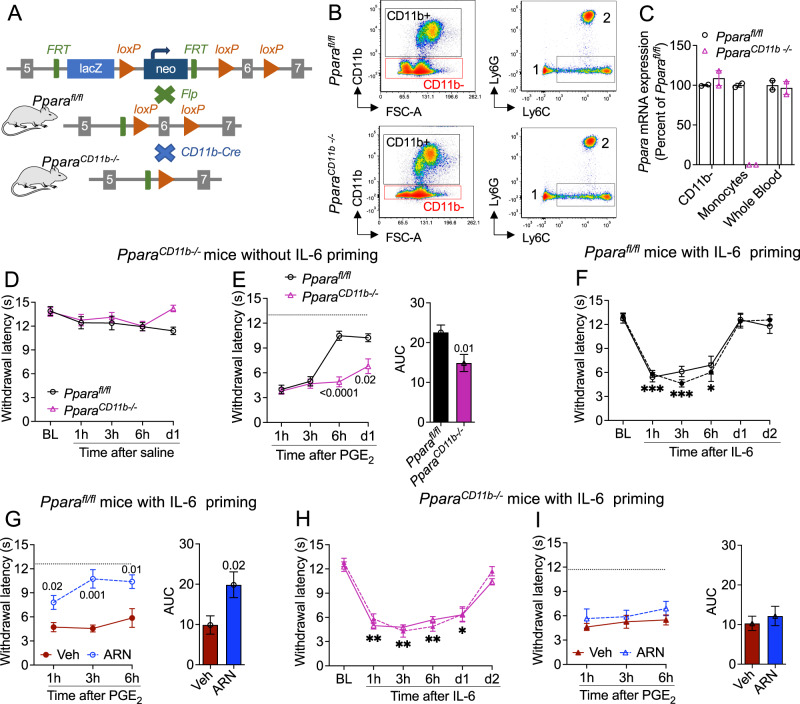
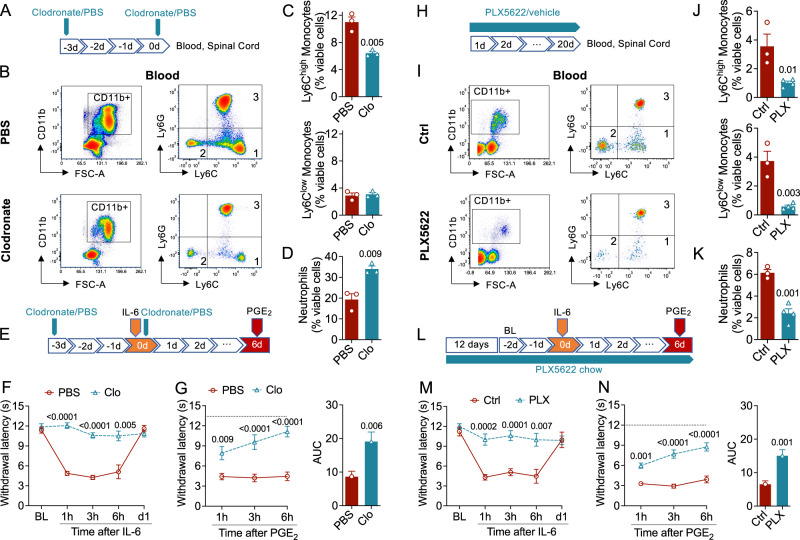
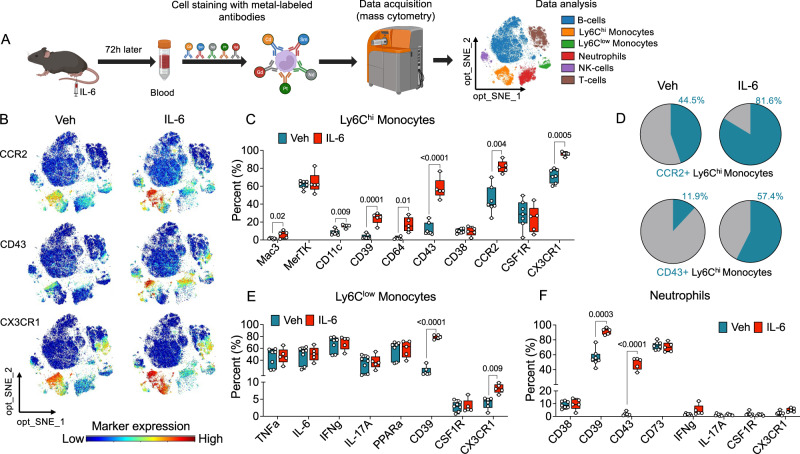
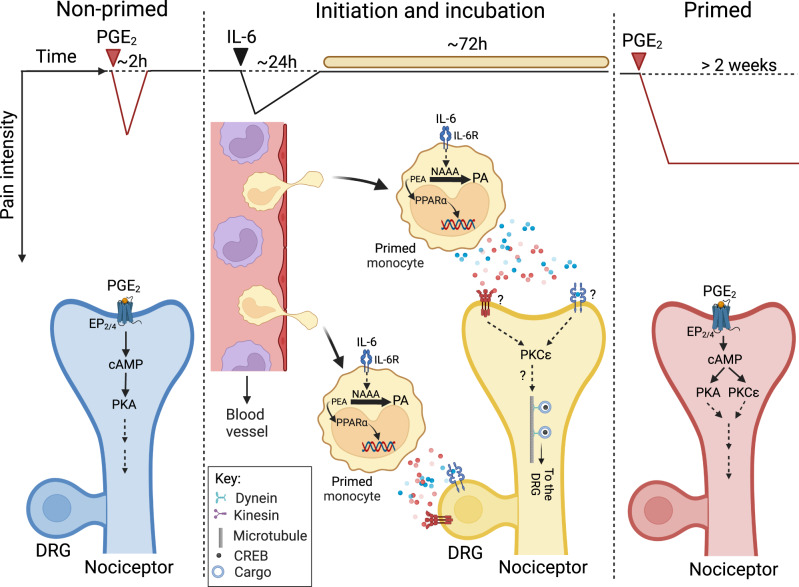
Circulating monocytes participate in pain chronification but the molecular events that cause their deployment are unclear. Using a mouse model of hyperalgesic priming (HP), we show that monocytes enable progression to pain chronicity through a mechanism that requires transient activation of the hydrolase, N-acylethanolamine acid amidase (NAAA), and the consequent suppression of NAAA-regulated lipid signaling at peroxisome proliferator-activated receptor-α (PPAR-α). Inhibiting NAAA in the 72 hours following administration of a priming stimulus prevented HP. This effect was phenocopied by NAAA deletion and depended on PPAR-α recruitment. Mice lacking NAAA in CD11b+ cells - monocytes, macrophages, and neutrophils - were resistant to HP induction. Conversely, mice overexpressing NAAA or lacking PPAR-α in the same cells were constitutively primed. Depletion of monocytes, but not resident macrophages, generated mice that were refractory to HP. The results identify NAAA-regulated signaling in monocytes as a control node in the induction of HP and, potentially, the transition to pain chronicity.


Conflict of interest statement

D.P. and M.M. are inventors in patents that protect ARN19702 and other NAAA inhibitors, owned by the University of California, the University of Parma, the University of Urbino, and the Fondazione Istituto Italiano di Tecnologia (no. 13/898,225, filed 20 May 2013, published 3 April 2014; no. 62/337,744, filed 17 May 2016, published 23 November 2017). D.P. and Y.F. are inventors in a patent application that protects the algostatic effects of NAAA inhibitors, filed by the University of California (no. 63/166,134, filed 25 March 2021, published 29 September 2022). The other authors declare no competing interest. No specific aspect of the manuscript was covered in patent applications.

Figures

Fig. 1
Fig. 1. NAAA is required to induce hyperalgesic priming.
A Model used in the present study. In most experiments, priming was induced in mice by intraplantar administration of IL-6 and was assessed 6 days later by injecting PGE2 at the same site. Ipsilateral heat hypersensitivity (paw withdrawal latency, seconds) was measured under baseline (BL) conditions (−2d, −1d) and immediately after administration of IL-6 (0d), PGE2 (6d), or vehicle (0d and 6d). The blue bar marks the incubation period for priming. The illustration was generated, in part, with BioRender.com. B, D Self-resolving heat hypersensitivity elicited by IL-6 in mice that had received 2 h earlier (B) ARN19702 (ARN, 30 mg-kg−1; green circles; n = 8), (D) gabapentin (GBP, 50 mg-kg−1; green triangles; n = 8), or their vehicles (Veh, magenta circles; n = 8). C, E Effects of PGE2 in IL-6-primed mice treated with ARN19702 (C), gabapentin (E), or their vehicles. F, G IL-6-primed mice were treated on 1d-3d with vehicle (n = 16) or ARN19702 (30 mg-kg−1; n = 17). F Response to IL-6 before administration of vehicle (open symbols) or ARN19702 (closed symbols). G Effects of PGE2 in IL-6-primed mice that had received vehicle (magenta circles) or ARN19702 (green triangles). Right panel, area under the curve (AUC). H–J IL-6-primed mice (n = 10 per group) were treated with vehicle (magenta circles) or ARN19702 (30 mg-kg−1, filled triangles) for 2 days on 1d-2d, 3d-4d, or 5d-6d, and the response to PGE2 was assessed 3 days later. ARN19702 on (H) 1d-2d, (I) 3d-4d, and (J) 5d-6d. (K, L) Effects of (K) IL-6 (0d) and (L) PGE2 (6d) in wild-type (Wt, magenta circles, n = 10), heterozygous Naaa+/- (green triangles, n = 11), and homozygous Naaa-/- mice (green squares, n = 11). Data are presented as mean ± S.E.M. and were analyzed by two-way repeated measure ANOVA followed by Bonferroni’s multiple comparison test, when necessary. ***P < 0.001, **P < 0.01, *P < 0.05, versus baseline; ###P < 0.001, ##P < 0.01, #P < 0.05, versus vehicle or Wt. ns, non-significant. P values versus vehicle are shown, when possible. Dotted lines indicate baseline withdrawal latency. Source data are provided as a Source Data file.
Fig. 2
Fig. 2. Role of peripheral NAAA and PPAR-α signaling in initiation of hyperalgesic priming.
AC IL-6-primed mice were treated on 1d-3d with ARN19702 (ARN, 30 mg-kg−1) alone or in combination with GW6471 (4 mg-kg−1; n = 8), T0070907 (1 mg-kg−1; n = 7), AM630 (3 mg-kg−1; n = 8), or an appropriate vehicle (n = 8). Effects of PGE2 in mice treated with the following: (A) ARN19702 alone (green triangles), ARN19702 plus GW6471 (open squares), or vehicle (Veh, magenta circles); (B) ARN19702 alone (green triangles), ARN19702 plus T0070907 (open squares), or vehicle (magenta circles); and (C) ARN19702 alone (green triangles), ARN19702 plus AM630 (open squares), or vehicle (magenta circles). (D, E) IL-6-primed mice were treated on 1d-3d with PEA (30 mg-kg−1; n = 8) or GW7647 (10 mg-kg−1; n = 8). Effects of PGE2 in mice treated with (D) PEA (green circles) or vehicle (magenta circles); and (E) GW7647 (green circles) or vehicle (magenta circles). F Time-course of ARN726 concentrations in plasma (green circles) and spinal cord (gray squares) after IP administration in mice (10 mg-kg−1; n = 5 per group/time point). Top, chemical structure of ARN726. Right panel, area under the curve (AUC). GI Effect of ARN726 (10 mg-kg−1) on plasma concentrations of (G) PEA, (H) OEA, and (I) anandamide (AEA). Gray bars, baseline plasma concentrations. JL Effect of ARN726 (10 mg-kg−1) on the spinal cord concentrations of PEA (J), OEA (K), and AEA (L). Open bars, baseline analyte concentrations. M IL-6-primed mice (n = 7-8 per group) were treated on 1d-3d with ARN726 (1-30 mg-kg−1) and the response to PGE2 was assessed on 6d. % MPE, percent of maximal possible effect. N Effects of intrathecal vehicle (magenta circles) or ARN726 (30 ng, administered on 1d and 3d) (green circles) on the response to PGE2 in IL-6 primed mice (n = 7-8 per group). Data are presented as mean ± S.E.M. and were analyzed using the two-tailed unpaired Student’s t test (F, AUC), one-way ANOVA (GL), or two-way repeated measure ANOVA (AF, N). Dunnett’s or Bonferroni’s post hoc test was applied as needed. P values versus vehicle or baseline/time 0 are indicated. Dotted lines indicate baseline withdrawal latency. Source data are provided as a Source Data file.
Fig. 3
Fig. 3. NAAA in CD11b+ myeloid cells initiates hyperalgesic priming.
A Generation of NaaaCD11b-/- mice. Cross-breeding of global Naaa-/- mice with flippase (fl) FLPo-10 mice produced Naaafl/fl offspring, which was mated with CD11b-Cre mice to yield the NaaaCD11b-/- line. Yellow boxes: Naaa coding sequences; green boxes, Flp recognition target (FRT) sites; gray triangles: loxP sites flanking the deleted Naaa sequence. The illustration was generated in PowerPoint. Mouse image was obtained from ChemDraw. B FACS tracings showing isolation of monocytes from blood samples of (top panels) Naaafl/fl and (bottom panels) NaaaCD11b-/- mice. Left, isolation of CD11b+ cells; right, isolation of Ly6C+ monocytes. The square denotes the Ly6Chigh (‘classical’) monocyte subpopulation collected for RT-qPCR analysis. 1, Ly6Clow (‘non-classical’) monocytes; 2, neutrophils. C Naaa mRNA levels (assessed by RT-qPCR) in FACS-isolated CD11b- cells and Ly6Chigh monocytes from NaaaCD11b-/- mice (green circles, n = 3) and Naaafl/fl (magenta circles, n = 3). Whole blood is shown for comparison. Bars represent the average of 3 biological replicates. D Self-resolving heat hypersensitivity elicited by IL-6 in NaaaCD11b-/- mice (green circles, n = 7) and control Naaafl/fl mice (magenta circles, n = 8). E Effects of PGE2 in IL-6-primed NaaaCD11b-/- mice (green circles) and control Naaafl/fl mice (magenta circles). F Normal heat sensitivity in NaaaCD11b+ mice (orange triangles, n = 8) and their wild-type littermates (Wt, blue circles, n = 8) after saline injection (20 μL). G Effects of PGE2 in NaaaCD11b+ (orange triangles) and wild-type littermates (blue circles). Data are expressed as mean ± S.E.M. and were analyzed using the two-tailed unpaired Student’s t test (AUC) or two-way repeated measure ANOVA. Bonferroni’s post hoc test was applied as appropriate. P values versus Naaafl/fl or Wt are indicated. Dotted lines indicate baseline withdrawal latency. Source data are provided as a Source Data file.
Fig. 4
Fig. 4. PPAR-α in CD11b+ myeloid cells counters hyperalgesic priming.
A Generation of PparaCD11b-/- mice. Global Ppara-/- mice were mated with flippase (fl) FLPo-10 mice and the offspring was cross-bred with CD11b-Cre mice to yield the PparaCD11b-/- line. Gray boxes: Ppara coding sequences; green boxes, Flp recognition target (FRT) sites; gray triangles: loxP sites flanking the deleted Ppara sequence. The illustration was generated in PowerPoint. Mouse image was obtained from ChemDraw. B FACS tracings showing the isolation of monocytes from blood samples of (top) Pparafl/fl and (bottom) PparaCD11b-/- mice. Left, isolation of CD11b+ cells; right, isolation of Ly6C+ monocytes. The square denotes the Ly6Chigh (‘classical’) monocyte subpopulation collected for RT-qPCR analysis. 1, Ly6Clow (‘non-classical’) monocytes; 2, neutrophils. C Ppara mRNA levels (assessed by RT-qPCR) in FACS-isolated CD11b- cells and Ly6Chigh monocytes from Pparafl/fl (open circles, n = 2) and PparaCD11b-/- (magenta triangles, n = 2) mice. Whole blood is shown for comparison. Bars represent the average of 2 biological replicates. D Normal heat sensitivity in Pparafl/fl and PparaCD11b-/- mice (n = 8 per group) after saline injection (20 μL). E Effects of PGE2 in non-primed (saline-injected) Pparafl/fl and PparaCD11b-/- mice. Right panel, area under the curve (AUC). F, G IL-6-primed Pparafl/fl mice were treated on 1d-3d with vehicle or ARN19702 (30 mg-kg−1). F Effect of IL-6 before administration of vehicle (open symbols, n = 10) or ARN19702 (closed symbols, n = 10). G Effects of PGE2 in IL-6-primed Pparafl/fl mice after administration of vehicle (red circles) or ARN19702 (blue circles). Right panel, AUC. H, I IL-6-primed PparaCD11b-/- mice (n = 7 per group) were treated on 1d-3d with vehicle or ARN19702 (30 mg-kg−1). H Self-resolving heat hypersensitivity elicited by IL-6 before administration of vehicle (open symbols) or ARN19702 (closed symbols). (I) Effect of PGE2 in IL-6-primed PparaCD11b-/- mice after administration of vehicle (red triangles) or ARN19702 (blue triangles). Right panel, AUC. Data are represented as mean ± S.E.M. and were analyzed using the two-tailed unpaired Student’s t test (AUC) or two-way repeated measure ANOVA. ***P < 0.001, **P < 0.01, *P < 0.05, versus baseline. P values versus Pparafl/fl or vehicle are shown, when possible. Dotted lines indicate baseline withdrawal latency. Source data are provided as a Source Data file.
Fig. 5
Fig. 5. Monocytes, not neutrophils, are required for hyperalgesic priming.
AD Verification of monocyte removal by clodronate. A Experimental timeline for the injection of liposomes containing clodronate or PBS. B FACS tracings of blood samples from mice treated with (top) PBS or (bottom) clodronate. Left, isolation of CD11b+ cells; right, isolation of Ly6Chigh (‘classical’) monocytes (1), Ly6Clow (‘non-classical’) monocytes (2), and neutrophils (3). The squares denote areas selected for quantification. C, D Number of circulating (C) monocytes and (D) neutrophils in mice treated with PBS (red bar, n = 3) or clodronate (blue bar, n = 3). E Experimental timeline. IL-6 was administered in wild-type male mice immediately before the last clodronate/PBS injection. PGE2 was injected 6 days later. F Self-resolving heat hypersensitivity elicited by IL-6 in mice treated with PBS (red line, n = 8) or clodronate (Clo, blue line, n = 8). G Effects of PGE2 in IL-6 primed mice treated with PBS (red line) or clodronate (Clo, blue line). Right panel, area under the curve (AUC). HK Verification of monocyte removal by PLX5622. (H) Experimental timeline for treatment with PLX5622 or vehicle. (I) FACS tracings of blood samples from mice fed a chow-containing vehicle (top) or PLX5622 (bottom). Left, isolation of CD11b+ cells; right, isolation of Ly6Chigh monocytes (1), Ly6Clow monocytes (2), and neutrophils (3). The squares denote areas selected for quantification. J, K Number of circulating (J) monocytes and (K) neutrophils in mice exposed to control chow (red bar, n = 3) and chow containing PLX5622 (blue bar, n = 4). L Experimental timeline. IL-6 was administered in wild-type male mice after 14 days of exposure to control or PLX5622-containing chow. The treatment was continued and PGE2 was injected 6 days later. M Self-resolving heat hypersensitivity elicited by IL-6 in mice exposed to control chow (red line, n = 8) or PLX5622-containing chow (blue line, n = 10). N Effects of PGE2 in IL-6 primed mice exposed to control chow (red line) or PLX5622-containing chow (blue line). Right panel, AUC. Data are represented as mean ± S.E.M. and were analyzed using the two-tailed unpaired Student’s t test (AUC) or two-way repeated measure. P values versus PBS or control are indicated. Dotted lines indicate baseline withdrawal latency. Source data are provided as a Source Data file.
Fig. 6
Fig. 6. Monocyte activation during incubation of hyperalgesic priming.
A Schematic illustration of the CyTOF protocol used in these experiments. The optimized Stochastic Neighbor Embedding (opt-SNE) plot identifies six CD45+ cell populations in cardiac blood of vehicle- and IL-6-treated mice (n = 5-7 per group): B, T, and NK cells, Ly6Chigh and Ly6Clow monocytes, and neutrophils. The illustration was partially generated with BioRender.com. B opt-SNE plots depicting density heatmaps of cells expressing CCR2 (top), CD43 (middle), and CX3CR1 (bottom) in mice treated with vehicle (left; n = 7) or IL-6 (right; n = 5). C Boxplots showing quantification of activation markers in Ly6Chigh monocytes. D Pie charts showing distribution of CCR2+ (top) and CD43+ (bottom) Ly6Chigh monocytes in vehicle- (left) and IL-6-treated (right) mice. Numbers indicate percentages of total cell number. E, F Boxplots showing quantification of activation markers in Ly6Clow monocytes (E) and neutrophils (F). Data in C, E, and F are presented in box and whiskers plots showing the median, interquartile range, the minimum and maximum values. They were obtained from 5-7 independent biological replicates and analyzed by multiple two-tailed unpaired t test with Bonferroni’s correction. Adjusted P values versus vehicle are indicated. Source data are provided as a Source Data file.
Fig. 7
Fig. 7. A role for NAAA-regulated PPAR-α signaling in hyperalgesic priming.
Left: non-primed state. In this naïve state, PGE2 produces transient (~2 h) heat and mechanical hypersensitivity by engaging protein kinase A (PKA)-coupled EP2/EP4 receptors in isolectin-B4+ nociceptive neurons. Center: initiation and incubation. Various cytokines (e.g., IL-6) and other noxious stimuli (e.g., growth factors, tissue damage, etc.) evoke a self-resolving nocifensive response that lasts ~24 h and is attenuated by standard analgesics (,, present study). In parallel, the stimuli initiate priming through a mechanism that is insensitive to analgesics. This initiation phase is followed by an incubation period, which persists for ~72 h, during, which NAAA activity interrupts PPAR-α signaling and drives monocytes into an active (or’primed’) state, which enables them to migrate to target tissues (including the dorsal root ganglia, DRG), interact with nociceptors – presumably via one or more unknown chemical signals (colored circles) – and effect neuroplastic changes that initiate priming. Right: primed state. In primed animals, EP2/EP4 receptors in isolectin-B4+ nociceptors are coupled to an additional transduction pathway that involves protein kinase C-epsilon (PKCε). In this state, PGE2 evokes a PKCε-mediated heat hypersensitivity that can last >2 weeks. Figure created with BioRender.com.

References

    1. Dahlhamer J, et al. Prevalence of Chronic Pain and High-Impact Chronic Pain Among Adults - United States, 2016. MMWR Morb. Mortal. Wkly Rep. 2018;67:1001–1006. doi: 10.15585/mmwr.mm6736a2. - DOI - PMC - PubMed
    1. Goldberg DS, McGee SJ. Pain as a global public health priority. BMC Public Health. 2011;11:770. doi: 10.1186/1471-2458-11-770. - DOI - PMC - PubMed
    1. Cohen SP, Vase L, Hooten WM. Chronic pain: an update on burden, best practices, and new advances. Lancet. 2021;397:2082–2097. doi: 10.1016/S0140-6736(21)00393-7. - DOI - PubMed
    1. Price TJ, et al. Transition to chronic pain: opportunities for novel therapeutics. Nat. Rev. Neurosci. 2018;19:383–384. doi: 10.1038/s41583-018-0012-5. - DOI - PMC - PubMed
    1. Basbaum AI, Bautista DM, Scherrer G, Julius D. Cellular and molecular mechanisms of pain. Cell. 2009;139:267–284. doi: 10.1016/j.cell.2009.09.028. - DOI - PMC - PubMed