

A history of avoidance does not impact extinction learning in male rats
- PMID: 38402221
- PMCID: PMC10894225
- DOI: 10.1038/s41539-024-00223-z
A history of avoidance does not impact extinction learning in male rats
Abstract
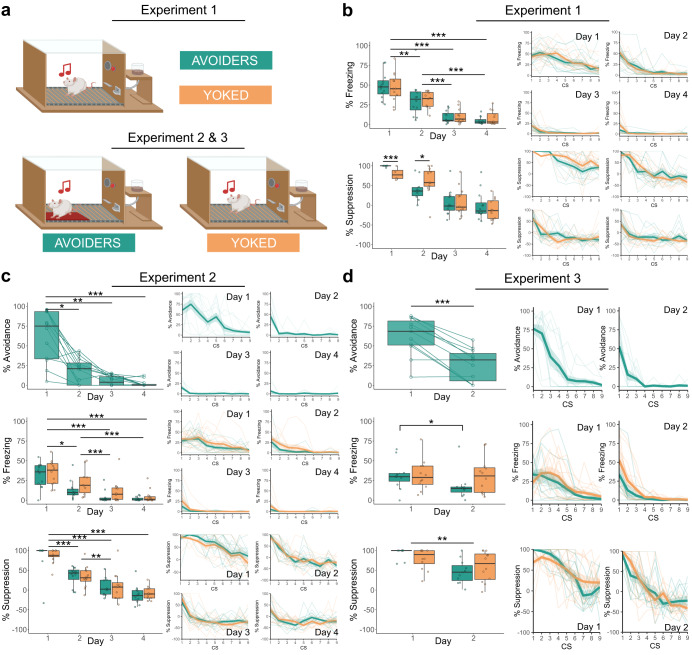
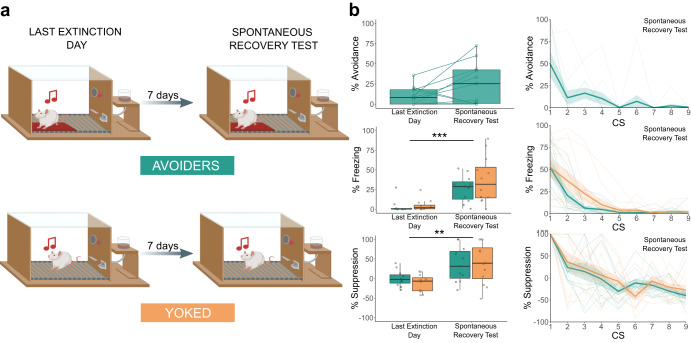
Pervasive avoidance is one of the central symptoms of all anxiety-related disorders. In treatment, avoidance behaviors are typically discouraged because they are assumed to maintain anxiety. Yet, it is not clear if engaging in avoidance is always detrimental. In this study, we used a platform-mediated avoidance task to investigate the influence of avoidance history on extinction learning in male rats. Our results show that having the opportunity to avoid during fear acquisition training does not significantly influence the extinction of auditory-cued fear in rats subjected to this platform-mediated avoidance procedure, which constitutes a realistic approach/avoidance conflict. This holds true irrespective of whether or not avoidance was possible during the extinction phase. This suggests that imposing a realistic cost on avoidance behavior prevents the adverse effects that avoidance has been claimed to have on extinction. However, avoidance does not appear to have clear positive effects on extinction learning nor on retention either.
© 2024. The Author(s).
Conflict of interest statement
The authors declare no competing interests.
Figures


Similar articles
-
Danger and safety signals independently influence persistent pathological avoidance in anxiety-vulnerable Wistar Kyoto rats: A role for impaired configural learning in anxiety vulnerability.Behav Brain Res. 2019 Jan 1;356:78-88. doi: 10.1016/j.bbr.2018.07.025. Epub 2018 Jul 29. Behav Brain Res. 2019. PMID: 30063948
-
Paired-housing selectively facilitates within-session extinction of avoidance behavior, and increases c-Fos expression in the medial prefrontal cortex, in anxiety vulnerable Wistar-Kyoto rats.Physiol Behav. 2016 Oct 1;164(Pt A):198-206. doi: 10.1016/j.physbeh.2016.05.044. Epub 2016 May 24. Physiol Behav. 2016. PMID: 27235339
-
The effect of social anxiety on the acquisition and extinction of low-cost avoidance.Behav Res Ther. 2021 Nov;146:103967. doi: 10.1016/j.brat.2021.103967. Epub 2021 Sep 11. Behav Res Ther. 2021. PMID: 34537441
-
Overcoming avoidance in anxiety disorders: The contributions of Pavlovian and operant avoidance extinction methods.Neurosci Biobehav Rev. 2019 Mar;98:61-70. doi: 10.1016/j.neubiorev.2019.01.007. Epub 2019 Jan 7. Neurosci Biobehav Rev. 2019. PMID: 30629978 Review.
-
The role of associative fear and avoidance learning in anxiety disorders: Gaps and directions for future research.Neurosci Biobehav Rev. 2018 May;88:117-140. doi: 10.1016/j.neubiorev.2018.03.015. Epub 2018 Mar 14. Neurosci Biobehav Rev. 2018. PMID: 29550209 Review.
Cited by
-
Social context modulates active avoidance: Contributions of the anterior cingulate cortex in male and female rats.Neurobiol Stress. 2024 Dec 5;34:100702. doi: 10.1016/j.ynstr.2024.100702. eCollection 2025 Jan. Neurobiol Stress. 2024. PMID: 39737250 Free PMC article.
-
Modifying the platform-mediated avoidance task: A new protocol to study active avoidance within a social context in rats.PLoS One. 2025 Apr 29;20(4):e0321776. doi: 10.1371/journal.pone.0321776. eCollection 2025. PLoS One. 2025. PMID: 40299933 Free PMC article.
-
Generalization and extinction of platform-mediated avoidance in male and female rats.Sci Rep. 2025 Mar 21;15(1):9730. doi: 10.1038/s41598-025-94265-x. Sci Rep. 2025. PMID: 40118949 Free PMC article.
References
-
- American Psychiatric Association. Diagnostic and Statistical Manual of Mental Disorders 5th edn (American Psychiatric Association, 2014).
Grants and funding
LinkOut - more resources
Full Text Sources
