. 2024 Feb 24;15(1):1700.
doi: 10.1038/s41467-024-45996-4.

The ATR inhibitor ceralasertib potentiates cancer checkpoint immunotherapy by regulating the tumor microenvironment

Affiliations

The ATR inhibitor ceralasertib potentiates cancer checkpoint immunotherapy by regulating the tumor microenvironment

Elizabeth L Hardaker et al. Nat Commun. .

Abstract

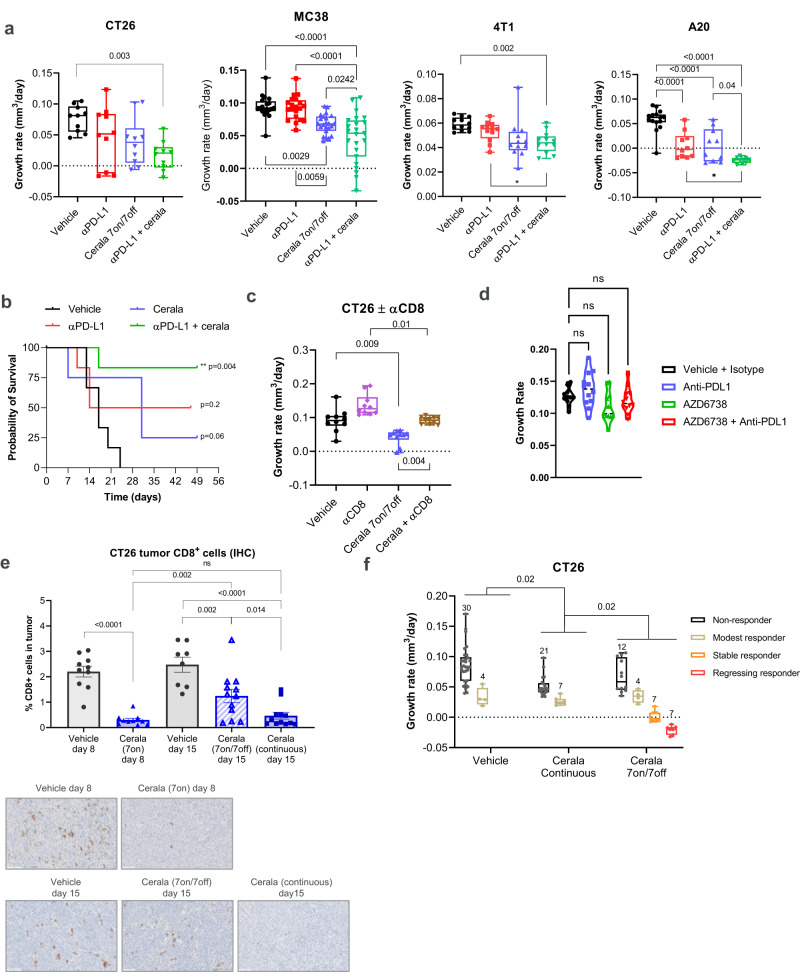
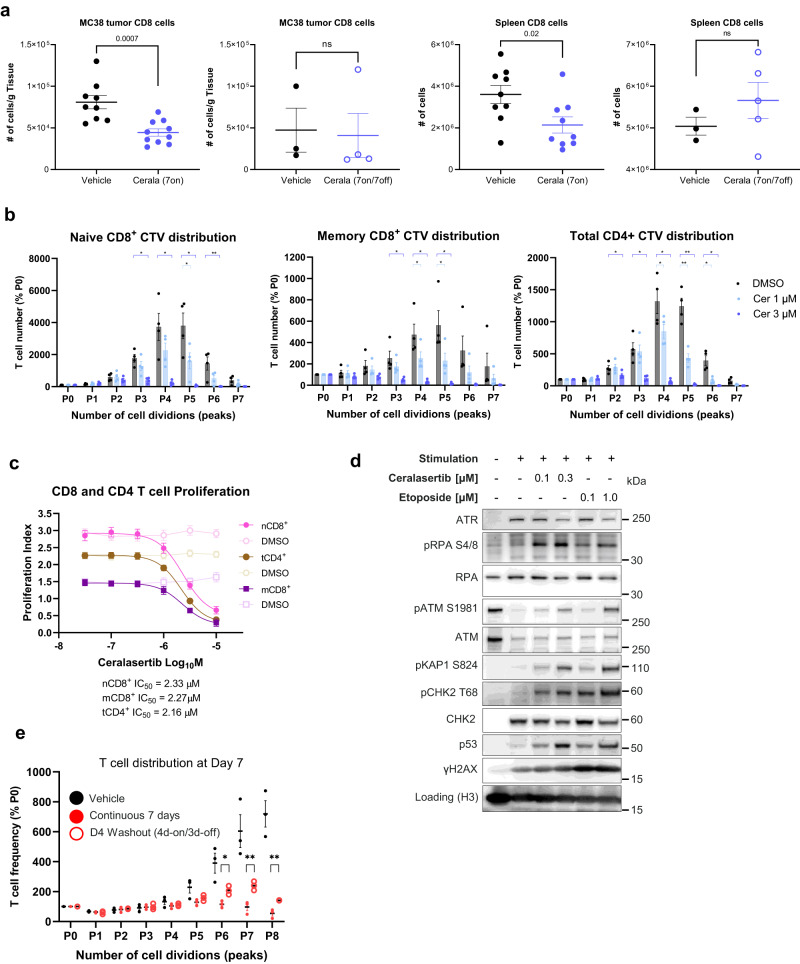
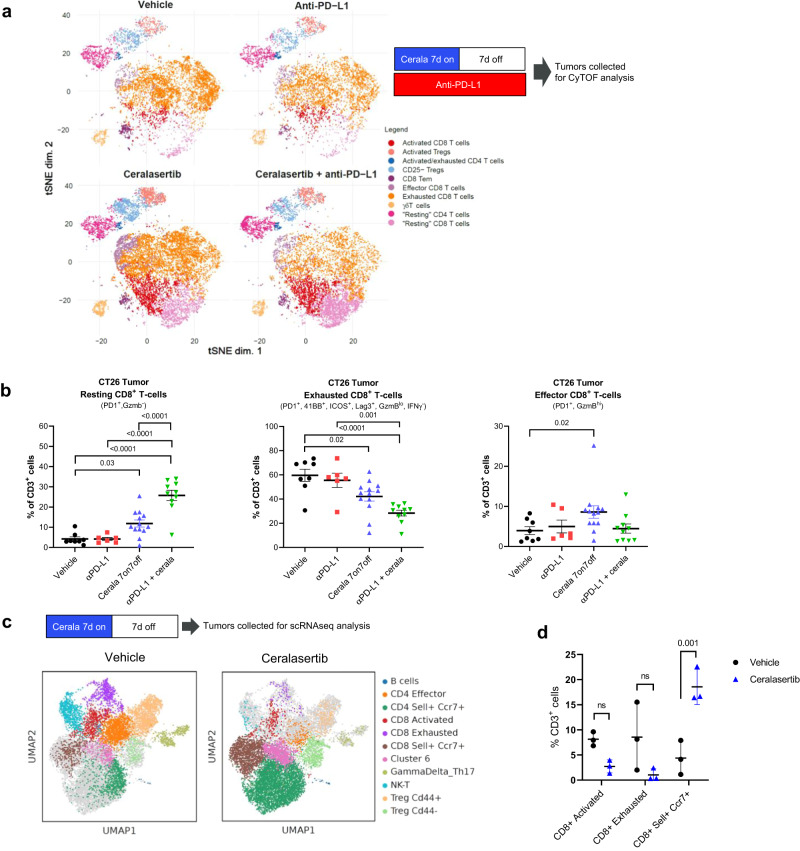
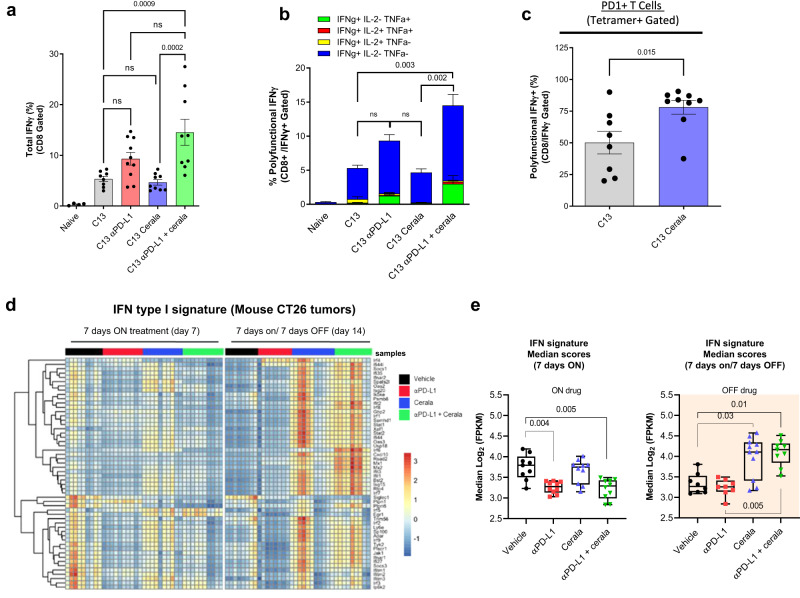
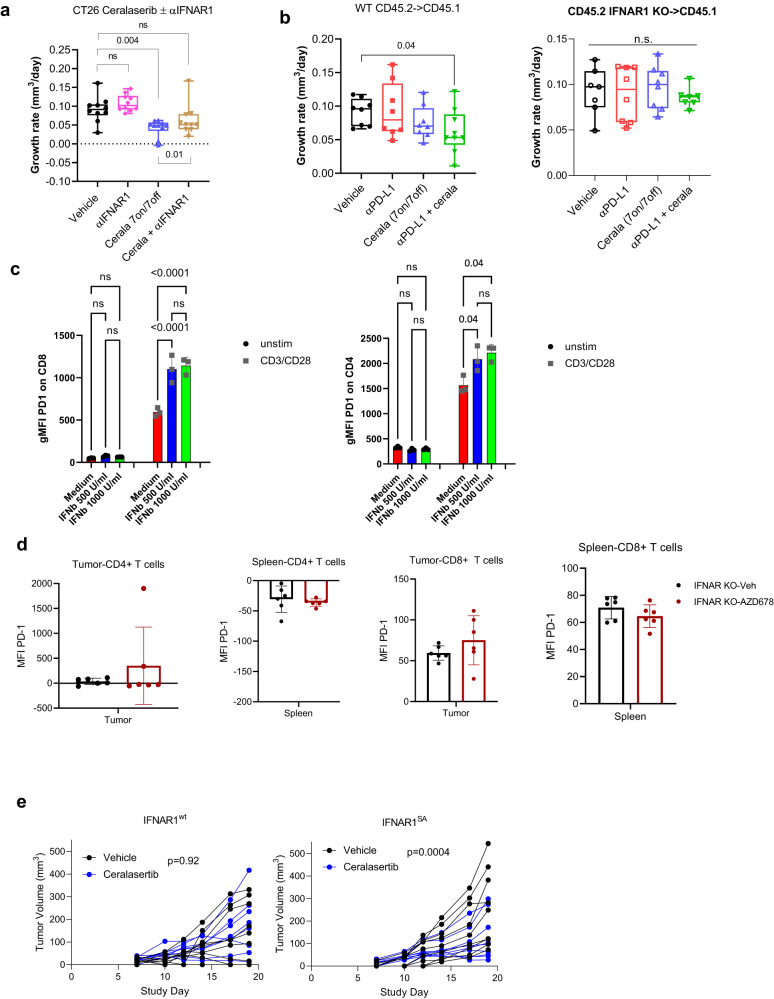
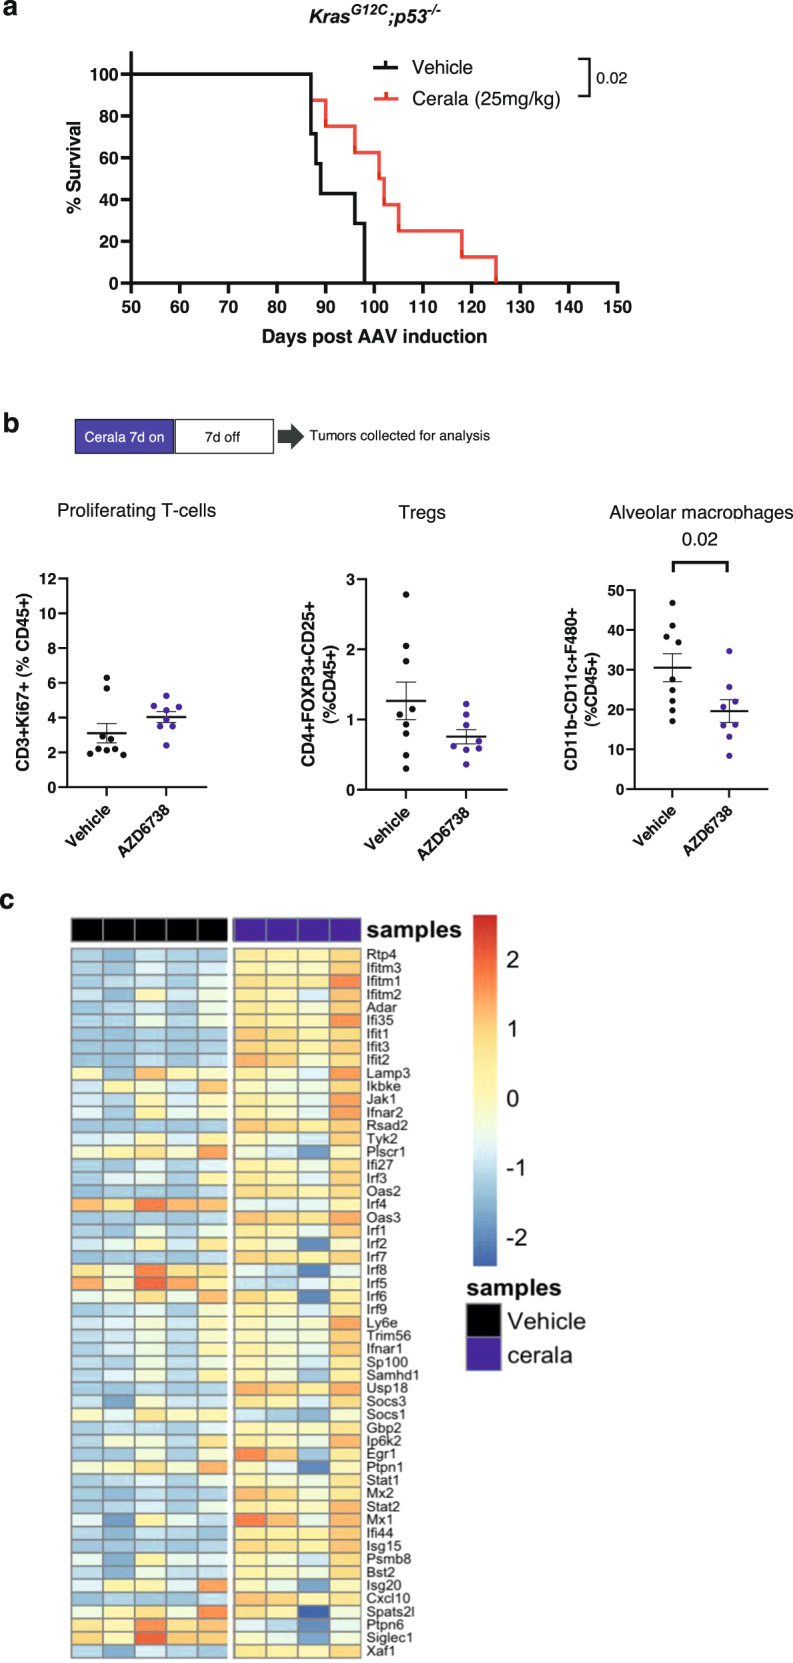
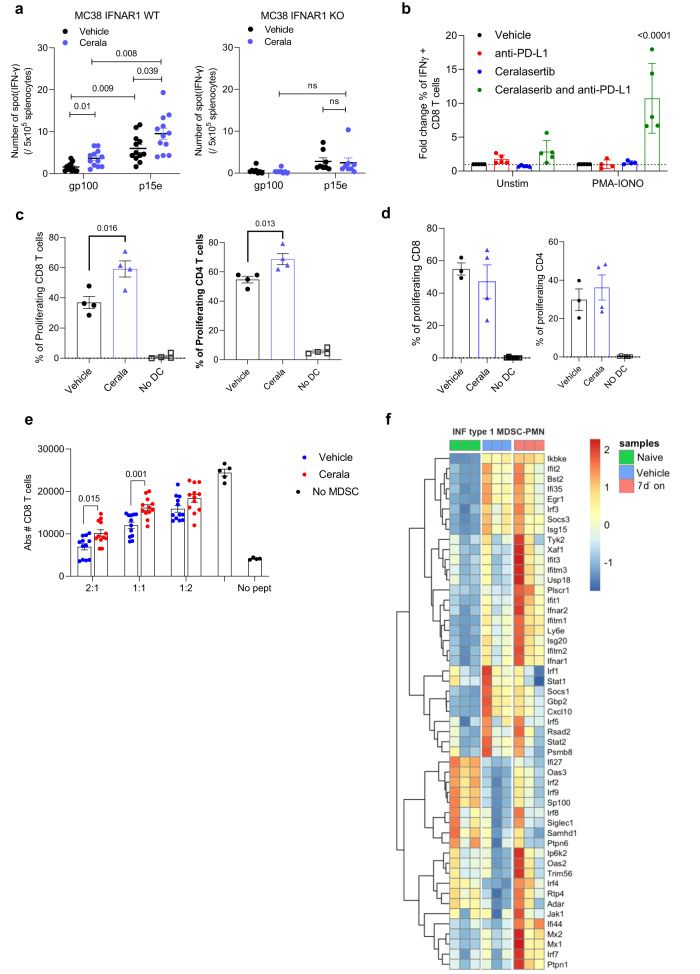
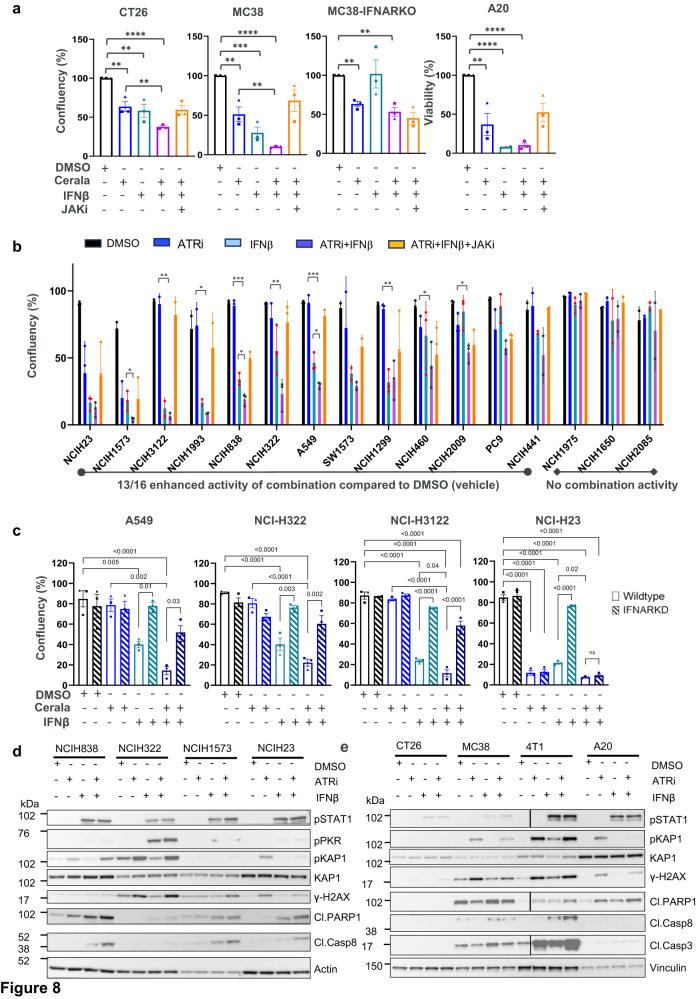
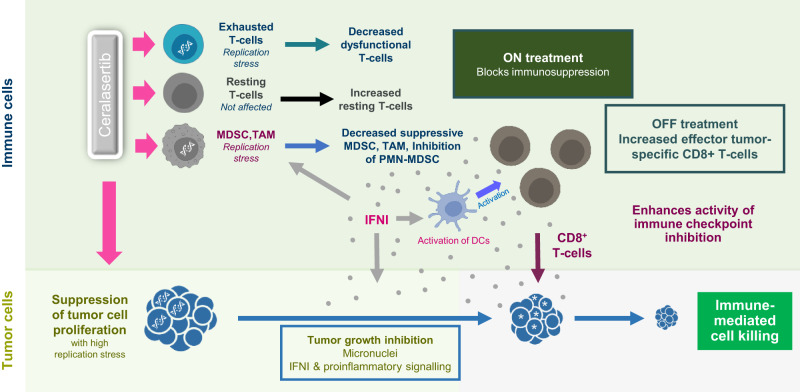
The Ataxia telangiectasia and Rad3-related (ATR) inhibitor ceralasertib in combination with the PD-L1 antibody durvalumab demonstrated encouraging clinical benefit in melanoma and lung cancer patients who progressed on immunotherapy. Here we show that modelling of intermittent ceralasertib treatment in mouse tumor models reveals CD8+ T-cell dependent antitumor activity, which is separate from the effects on tumor cells. Ceralasertib suppresses proliferating CD8+ T-cells on treatment which is rapidly reversed off-treatment. Ceralasertib causes up-regulation of type I interferon (IFNI) pathway in cancer patients and in tumor-bearing mice. IFNI is experimentally found to be a major mediator of antitumor activity of ceralasertib in combination with PD-L1 antibody. Improvement of T-cell function after ceralasertib treatment is linked to changes in myeloid cells in the tumor microenvironment. IFNI also promotes anti-proliferative effects of ceralasertib on tumor cells. Here, we report that broad immunomodulatory changes following intermittent ATR inhibition underpins the clinical therapeutic benefit and indicates its wider impact on antitumor immunity.


Conflict of interest statement

S.Y.F., U.D., P.J.L., M.A.N. and C.A.G.R. declare no competing interests. All other authors are employee and shareholders of AstraZeneca.

Figures

Fig. 1
Fig. 1. ATR inhibition has immune driven CD8+ T-cell dependent antitumor activity in syngeneic immunocompetent mouse tumor models.
a Tumor growth rate (TGR) for CT26 (N = 10), MC38 (N = 20 for vehicle and PD-1 groups and 23 for two other groups), 4T1 (N = 12), and A20 (N = 15 for vehicle group and N = 10 for all other groups). TB mice treated as indicated. Ceralasertib (25 mg/kg p.o. b.i.d.), PD-L1 antibody (αPD-L1; 10 mg/kg i.p. b.i.w) b Kaplan–Meier survival (time-to-event) plot for mice bearing CT26 tumors. An event was scored when a tumor volume exceeded 1 cm3. Log-rank (Mantel–Cox) test was used. c TGR for CT26 tumors in mice treated with ceralasertib with or without CD8 T-cell depleting antibody (αCD8). (N = 10). d Tumor growth in athymic MC38 TB mice treated as in (a). (N = 10). e Immunohistochemistry (IHC) analysis of proportion of CD8+ T-cells in CT26 tumors from mice treated with vehicle (N = 9) or ceralasertib (N = 10) following 7 days-on (on day 8), intermittent 7 days-on/7 days-off (on day 15) (vehicle N = 8, cerala N = 12) or continuously on-treatment for 15 days (N = 12). Top panel: cumulative results with bar charts showing individual tumors, mean and SEM. Bottom panel: representative images also shown with CD8+ T-cells stained brown. Scale bar = 50 µm. f Combined tumor growth rate analysis in 3 independent experiments comparing intermittent 7 days-on/7 days-off versus continuous ceralasertib dosing in CT26 TB mice. The number of mice per group are shown on the plot. Tumor response classification was obtained using INSPECTumors (see methods). Non-significant differences (p > 0.05) are denoted as NS or by the absence of p values (to maintain readability of the figures). In all graphs except b, one-way ANOVA with correction for multiple comparisons was used for statistical analysis. In all graphs box-whisker plots shows individual tumors, group median and min-max values. Source data are provided as a Source Data file.
Fig. 2
Fig. 2. ATR inhibition selectively suppresses proliferating T-cells in humans and mouse.
a The number of CD3+ CD8+ T-cells in MC38 tumors and spleens following treatment with vehicle or ceralasertib for 7 days (N = 9 for tumor and spleen) or 7 days-on/7 days-off (on day 15), (N = 4 for tumor, N = 5 for spleen). The number of cells for each subset was calculated per gram of tissue. Individual values, mean and SEM are shown. P values are shown on graph. NS not significant (p > 0.05). b Anti-proliferative activity of ceralasertib at indicated concentrations against in vitro stimulated/proliferating (CD3/CD28) T-cells from PBMCs isolated from different healthy donors (N = 4). Numbers represent proportion of T-cells in each cell division (P1 = 1 cell division, P2 = 2 cell divisions etc.) compared to non-proliferative cells (P0) after 6 days treatment with ceralasertib using CellTrace Violet (CTV). One way ANOVA test with correction for multiple comparisons between treated and DMSO vehicle control samples. Experiments were repeated once with 4 additional donors with the same results. c Anti-proliferative activity of ceralasertib vs vehicle (DMSO) in naïve CD8+ T-cells (nCD8+), memory CD8+ T-cells (mCD8+) and CD4+ T-cells (tCD4+). Four individual donors were tested. Experiment was repeated once with 4 additional donors with the same results. Individual results, mean and SEM are shown. d Western blot protein expression of DNA damage and cell cycle markers in unstimulated (naïve/resting) or in vitro stimulated/proliferating T-cells following 4 days vehicle (DMSO), ceralasertib, or etoposide treatments at the concentrations indicated. Representative experiment from one donor is shown. Four unique donors were profiled in parallel in one experiment showing the same results. Experiments were repeated once with the same results. e CTV proliferation assay for stimulated/proliferating T-cells after 7 days continuous or intermittent 4 days-on/3-days off ceralasertib exposure. Cells from 3 individual donors were tested. Individual results, mean and SEM are shown. Two-sided unpaired Student’s t-tests are shown as indicated. In (b, e) p values are shown as asterisk to maintain readability *p < 0.05, **p < 0.01, ***p < 0.001. Non-significant p values are not shown. Source data are provided as a Source Data file.
Fig. 3
Fig. 3. Intermittent ATR inhibition reshapes the tumor immune microenvironment which promotes immunotherapy activity.
a, b CyTOF single cell immunophenotyping of CD45+CD3+ immune populations in subcutaneous CT26 tumors (n = 10 per group) of mice treated with 25 mg/kg b.i.d. ceralasertib, 10 mg/kg anti-PD-L1 b.i.w. or their combination at the end of a 7 days-on/7 days-off treatment cycle (day 14). a Study design and t-SNE plots visualization of high level unbiased clustering analysis of CD3+ T-cell populations classified by cell surface marker expression as indicated. b Quantification of the proportions of resting, exhausted or effector CD8+ T-cell populations as a percentage of total CD3+ cells which were significantly modulated following treatment compared to vehicle control. Individual tumor values, group mean and SEM are shown. Statistical analysis performed by β-regression (R). c, d Single cell RNAseq analysis of CD3+ cells isolated from the tumors at the end of a 7 days-on/7 days off 25 mg/kg b.i.d. ceralasertib monotherapy treatment cycle (day 14) in CT26 tumors (n = 3 per group). c Study design and UMAP plot visualization of transcriptomic profiles of CD3+ expressing cells according to Leiden clustering. d Proportions of CD8+ T-cells populations as a percentage of the total CD3+ expressing cells per Leiden cluster vehicle and ceralasertib. Individual tumor values and group mean and SEMs are shown. Statistical analysis performed by one-way ANOVA with correction for multiple comparisons. In all panels ns means not significant (p > 0.05). P values are shown on the graphs. Source data are provided as a Source Data file.
Fig. 4
Fig. 4. Ceralasertib effect in LCMV infected and tumor-bearing mice.
a Proportion of gp33+IFNγ+ CD8+ T-cells in the spleen of LCMV infected mice treated as indicated on graph n = 10. Individual results, mean and SEM are shown. P values are calculated in one-way ANOVA with correction for multiple comparisons and shown on graphs. NS—p > 0.05. b Percentages of gp33+ CD8+ T-cells producing IFNγ, TNFα, and IL-2 were evaluated by intracellular staining. Biological replicates (mice) N = 10 are shown. Mean and SEM are shown. P values are calculated in one-way ANOVA with correction for multiple comparisons and shown on graphs. Not significant (p > 0.05). c PD1 expression on gp33+ CD8+ T-cells. Individual results (mice, N = 8), mean, and SEM are shown. P values were calculated in two-sided unpaired Student’s t-test. d, e Bulk RNAseq analysis of CT26 tumors from mice treated with 25 mg/kg b.i.d. ceralasertib, 10 mg/kg anti-PD-L1 b.i.w. or their combination when on ceralasertib treatment (7 days-on; day 7) and when off-treatment (at the end of 7 days-on/7 days-off cycle; day 14) as indicated. N = 8 for C13, N = 9 for C13 cerala. d Heatmap of Interferon type I signature gene expression, calculated from FPKM normalized counts expressed above biological viable levels, log-transformed and normalized for gene lengths. The data was z-transformed to be visualized in heatmap. e Box plots of median scores and maximum/minimum of interferon type I signature after 7 days on-treatment, or 7 days on/7 days off-treatment (N = 8). The medians were calculated of the log2-transformed FPKM for each sample and significance calculated using Fisher exact T-test. In all panels ns means not significant (p > 0.05). P values are shown on graphs. Source data are provided as a Source Data file.
Fig. 5
Fig. 5. IFNI mediates the effect of ceralasertib in tumor microenvironment.
a TGR of CT26 tumors in mice treated with ceralasertib 7 days-on/7 days-off and with an IFNAR1 blocking antibody b.i.w. Values for individual mice (N = 10), median, and min-max values are shown. Statistical analysis was performed using one-way ANOVA corrected for multiple comparisons. Box-whisker plots shows individual tumors, median and min-max values. NS—non-significant (p > 0.05). b WT or IFNAR1 KO BM cells were transferred to congenic lethally irradiated mice. After 8 weeks mice were implanted with MC38 tumor cells and treated with ceralasertib (6.25 mg/kg b.i.d.) with or without anti-PD-L1 (10 mg/kg b.i.w.). TGR for individual mice, median, and min-max are shown. n = 8 per group. Statistical analysis was performed with one-way ANOVA corrected for multiple comparisons. P values are shown on graphs. NS—non-significant (p > 0.05). c CD4+ and CD8+ T cells were isolated from spleens of naïve mice, treated for 72 h with indicated concentration of IFN-β in the presence of CD3/CD28 antibodies. Expression of PD1 was measured by flow cytometry. Individual results (N = 3), mean and SEM are shown. P values were calculated in One-way ANOVA with correction for multiple comparisons and shown on graphs were possible to maintain readability of the graphs **p < 0.01; ***p < 0.001. The same results were obtained after 48 h of treatment. d IFNAR1 KO (N = 6) MC38 TB mice treated for 7 days with ceralasertib as described for WT mice (Fig. S8C). Expression of PD1 was measured by flow cytometry in spleen and tumor CD4+ and CD8+ T cells and P values were calculated in two-sided unpaired Student’s t-test. Individual mice results (N = 6), mean and SEM are shown. e Tumor volume in mice reconstituted with BM from WT or IFNAR1SA mice and implanted 8 weeks later with MC38 tumor cells. Mice treated with 6.25 mg/kg ceralasertib for 7 days. N = 10 per group. Statistical analysis performed by Fishers test. Source data are provided as a Source Data file.
Fig. 6
Fig. 6. Ceralasertib improves survival of LUAD GEMM and impacts TIME.
a Kaplan–Meier survival analysis of TB mice treated with vehicle (n = 7) or ceralasertib (cerala) (n = 8) (Day 50 7days on / 7days off + 1day on). b GEMM KrasG12C;p53-/- lung tumors were profiled by flow cytometry for the indicated immune populations. The results of individual mice, median and SD are shown P values were calculated in two-sided unpaired Student’s t-test. N = 9 for vehicle, N = 9 for AZD6738 groups. Non-significant (p > 0.05) p values are not shown. N = 5 for vehicle and N = 4 for ceralasertib groups, c Heatmap of IFNI signature gene expression, calculated from FPKM normalized counts expressed above biological viable levels, log-transformed and normalized for gene lengths. The data was z-transformed to be visualized in heatmap. Source data are provided as a Source Data file.
Fig. 7
Fig. 7. IFNI signaling regulates tumor-specific T-cells.
a WT or IFNAR1 KO mice were implanted with MC38 tumor cells s.c. and treated with 25 mg/kg b.i.d. ceralasertib. Splenocytes were restimulated with tumor-specific (p15e) or irrelevant peptides (mGp100). Number of IFN-γ spots are shown. N = 12 WT, N = 6 IFNAR1 KO. Individual mouse results, mean and SEM are shown. Two-sided unpaired Student’s t-test was used. NS—non-significant (p > 0.05). b T-cells isolated from LN of mice treated with 10 mg/kg anti-PD-L1, 25 mg/kg b.i.d. ceralasertib, or combination were plated in the presence of feeder of control splenocytes, restimulated for 6 h with cell-stimulation cocktail, and stained for intracellular IFN-γ. Fold increase of % of IFN-γ+ cells within CD8+ T-cells is shown. N = 5. Individual mouse results, mean and SEM are shown. One-way ANOVA with correction for multiple comparisons was used. Non-significant p values (p > 0.05) are not shown. c DC were isolated from LN of MC38-bearing mice (C57BL/6) treated with 25 mg/kg b.id. ceralasertib and plated with BALB/c derived splenocytes labeled with Cell Trace Far-Red at a 1:5 (DC:splenosytes) ratio. After 5 days proliferation of CD8+ and CD4+ T-cells was measured by Cell-Trace dilution. N = 4. Individual mouse results, mean and SEM are shown. Two-sided unpaired Student’s t-test was usede. d Experiments were performed as in (c) except DC were isolated from LN of IFNAR1 KO MC38-bearing mice. N = 3—vehicle group, N = 4—Cerala group, N = 6—no DC group. Individual mouse results, mean and SEM are shown. e PMN-MDSC were isolated from tumors of mice treated for 7 days with 25 mg/kg b.i.d. ceralasertib and plated at different ratios with PMEL splenocytes in the presence of specific peptide. After 48 h the number of CD8+ T-cells was calculated by flow cytometry. N = 10. Individual mouse results, mean and SEM are shown. Two-sided unpaired Student’s t-test was used. Non-significant (p > 0.05) p values are not shown. f IFNI signature heatmap evaluated in PMN from naïve mice (N = 3), tumor PMN-MDSC isolated from mice treated with vehicle (N = 3) or with 25 mg/kg ceralsertib for 7 days (N = 3). Source data are provided as a Source Data file.
Fig. 8
Fig. 8. IFN signaling enhances the response of the ceralasertib by inducing apoptosis in some cell lines.
a, b Growth inhibition activity of monotherapy ceralasertib (1 μM) or IFN-β (1 ng/ml) or the combination with and without the presence of JAK inhibitor (5 μM). a mouse syngeneic cancer cell lines, including isogenic MC38 (IFNAR1 intact) and MC38 IFNAR1 knockout (KO) pairs. Bars show mean and SEM of three biological replicates where each replicate is represented as a symbol. b 16 human NSCLC cell lines. Bars show mean and SEM for three biological replicates. Statistical analysis comparing ceralasertib vs ceralasertib+IFN-β or IFN-β vs ceralasertib+IFN-β was performed by two-sided unpaired Student’s t-test and indicated on the graphs for each cell line. Asterisk are shown to maintain readability of the graphs. *p < 0.05, **p < 0.01, ***p < 0.001, ****p < 0.0001. Full statistical comparisons are in Supplementary Fig. 17C. c Growth inhibition activity of ceralasertib (0.3 μM) or IFN-β (1 ng/ml) or the combination in parental NSCLC cell lines with IFNAR1 (Wild-type) compared toIFNAR1 siRNA knockdown (IFNAR KD) cells. Bars show mean and SEM of three biological replicates where each replicate is represented as a symbol. Statistical analysis was performed by two-sided unpaired Student’s t-test. Asterisk are shown to maintain readability of the graphs. *p < 0.05, **p < 0.01, ***p < 0.001, ****p < 0.0001. Western blot assessing target engagement and apoptosis markers following 24 h of indicated treatments in (d), human NSCLC cell lines and (e), mouse cancer syngeneic cell lines. Two experiments with the same results were performed. Source data are provided as a Source Data file.
Fig. 9
Fig. 9. Ceralasertib treatment schedule results in diverse effects within the tumor microenvironment.
Ceralasertib treatment reduces tumor cell proliferation and depletes exhausted CD8+ T cells, M-MDSC and TAM by inhibiting ATR function in cells with replication stress. Treatment also induces type I IFN that neutralizes suppressive activity of M-MDSC and PMN-MDSC, activates DCs, up-regulate PD-1 expression on T cells, and enhances the inhibitory effect of ATRi on tumor cell proliferation. Intermittent scheduling of ceralasertib allows for appearance of newly generated functionally competent T cells. These T cells enter tumor microenvironment with activated of DCs, decreased presence of immune suppressive myeloid cells, and less potently proliferating tumor cells. Combination of these factors makes T cells more effective in recognizing tumor antigens. Increased PD-1 expression makes these T cells more susceptible to check-point inhibitors, which result in potent antitumor effect.

References

    1. Forment JV, O’Connor MJ. Targeting the replication stress response in cancer. Pharm. Ther. 2018;188:155–167. doi: 10.1016/j.pharmthera.2018.03.005. - DOI - PubMed
    1. Dillon MT, et al. ATR inhibition potentiates the radiation-induced inflammatory tumor microenvironment. Clin. Cancer Res. 2019;25:3392–3403. doi: 10.1158/1078-0432.CCR-18-1821. - DOI - PMC - PubMed
    1. Feng X, et al. ATR inhibition potentiates ionizing radiation-induced interferon response via cytosolic nucleic acid-sensing pathways. EMBO J. 2020;39:e104036. doi: 10.15252/embj.2019104036. - DOI - PMC - PubMed
    1. Sheng H, et al. ATR inhibitor AZD6738 enhances the antitumor activity of radiotherapy and immune checkpoint inhibitors by potentiating the tumor immune microenvironment in hepatocellular carcinoma. J. Immunother. Cancer. 2020;8:e000340. doi: 10.1136/jitc-2019-000340. - DOI - PMC - PubMed
    1. Vendetti FP, et al. ATR kinase inhibitor AZD6738 potentiates CD8+ T cell-dependent antitumor activity following radiation. J. Clin. Invest. 2018;128:3926–3940. doi: 10.1172/JCI96519. - DOI - PMC - PubMed