. 2024 Feb 24;15(1):1686.
doi: 10.1038/s41467-024-46021-4.

T-DOpE probes reveal sensitivity of hippocampal oscillations to cannabinoids in behaving mice

Affiliations

T-DOpE probes reveal sensitivity of hippocampal oscillations to cannabinoids in behaving mice

Jongwoon Kim et al. Nat Commun. .

Abstract

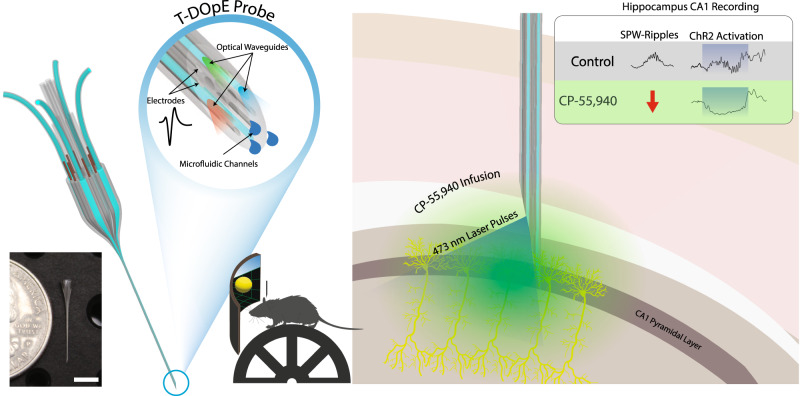
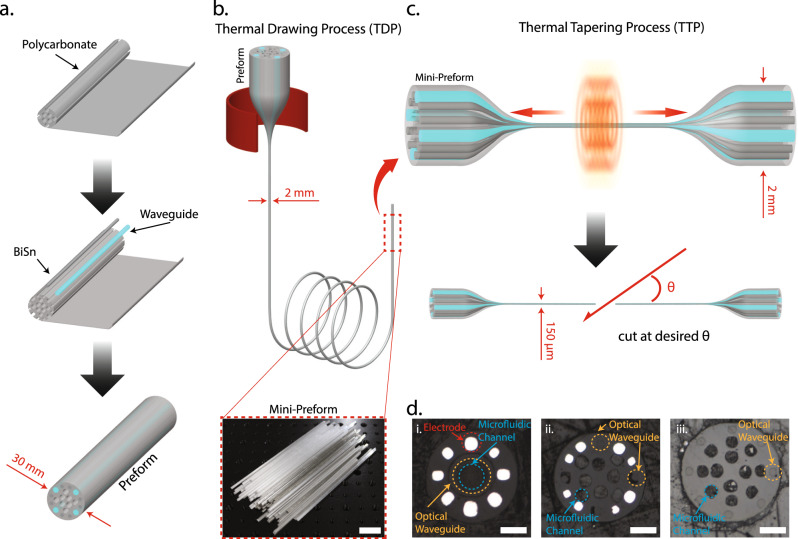
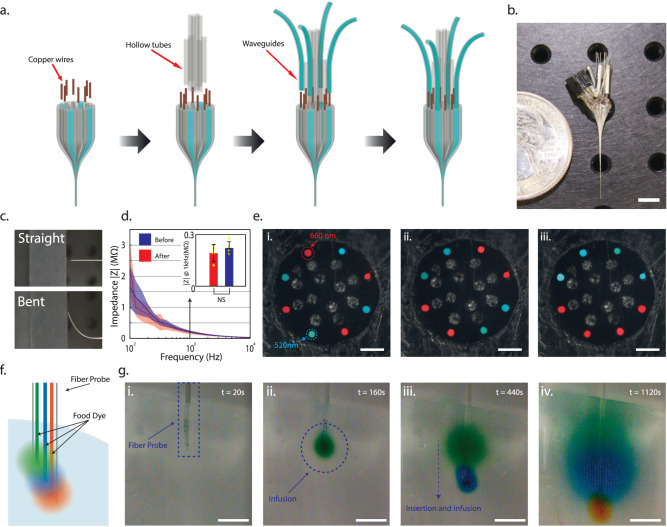
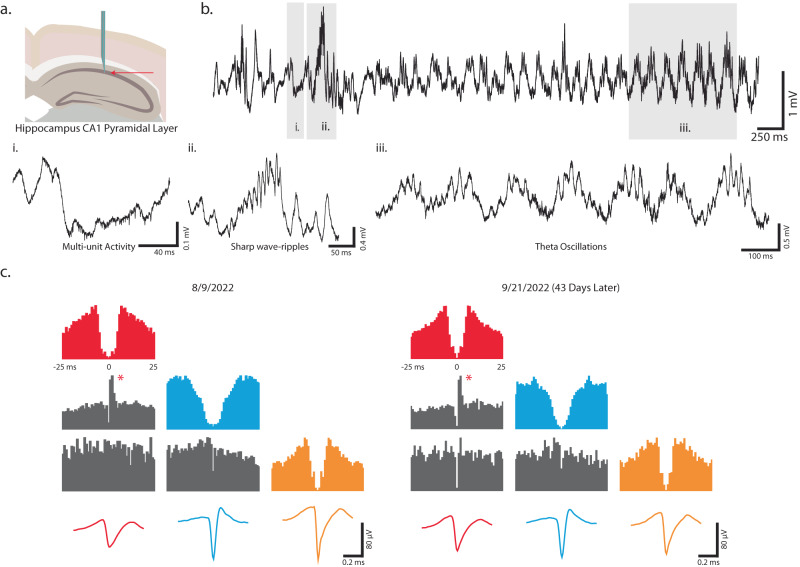
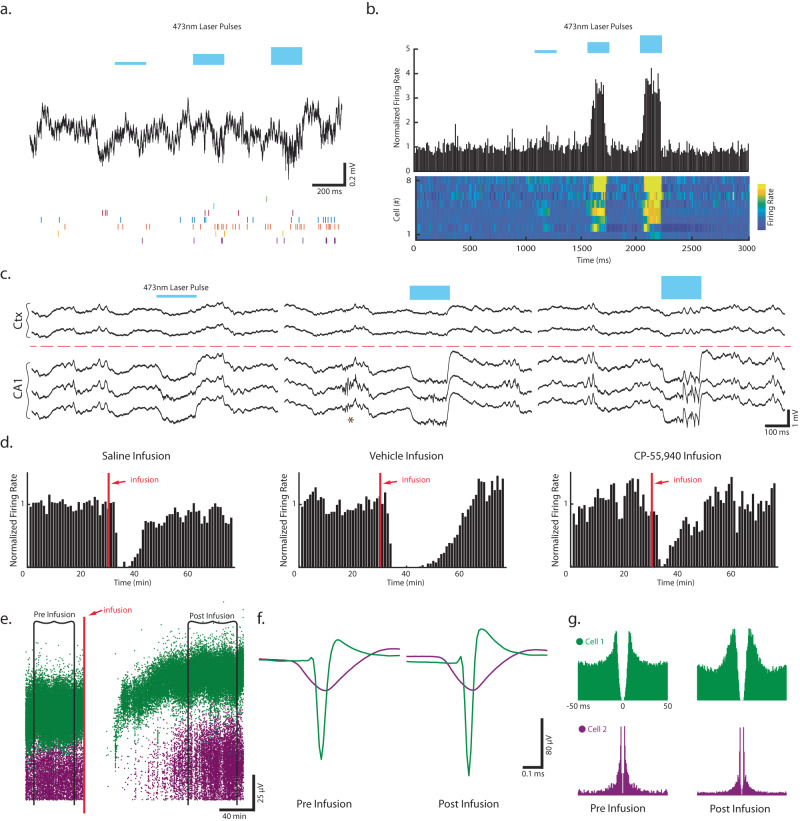
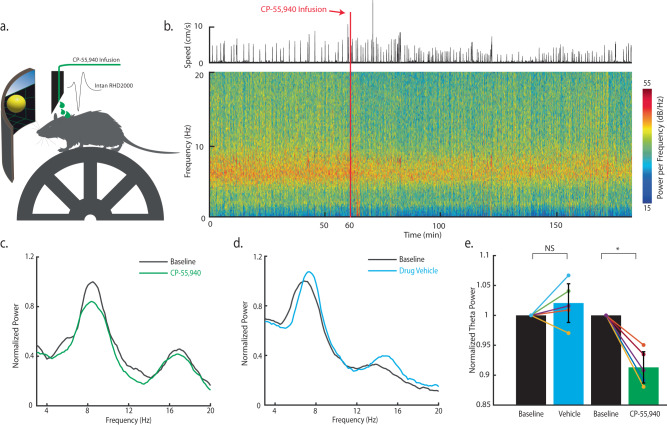
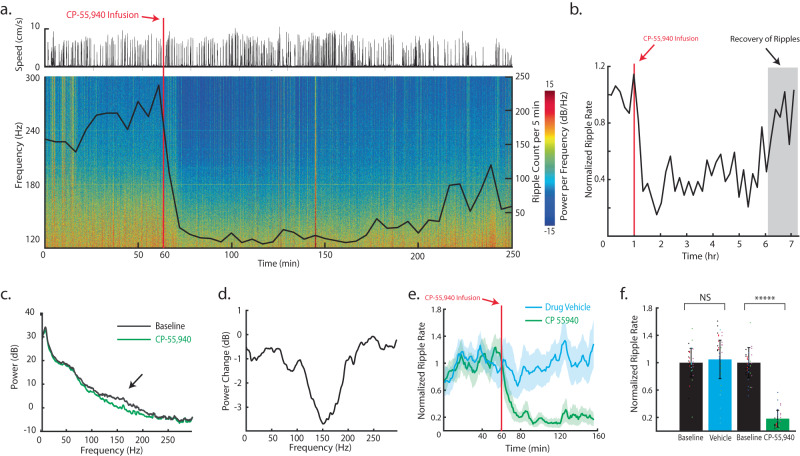
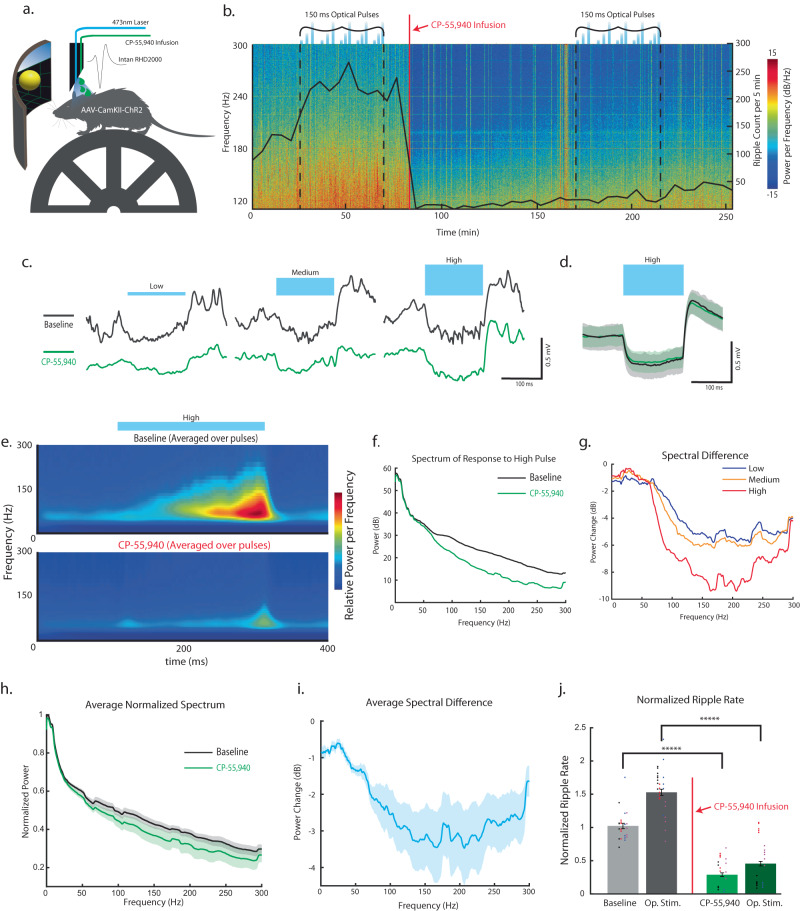
Understanding the neural basis of behavior requires monitoring and manipulating combinations of physiological elements and their interactions in behaving animals. We developed a thermal tapering process enabling fabrication of low-cost, flexible probes combining ultrafine features: dense electrodes, optical waveguides, and microfluidic channels. Furthermore, we developed a semi-automated backend connection allowing scalable assembly. We demonstrate T-DOpE (Tapered Drug delivery, Optical stimulation, and Electrophysiology) probes achieve in single neuron-scale devices (1) high-fidelity electrophysiological recording (2) focal drug delivery and (3) optical stimulation. The device tip can be miniaturized (as small as 50 µm) to minimize tissue damage while the ~20 times larger backend allows for industrial-scale connectorization. T-DOpE probes implanted in mouse hippocampus revealed canonical neuronal activity at the level of local field potentials (LFP) and neural spiking. Taking advantage of the triple-functionality of these probes, we monitored LFP while manipulating cannabinoid receptors (CB1R; microfluidic agonist delivery) and CA1 neuronal activity (optogenetics). Focal infusion of CB1R agonist downregulated theta and sharp wave-ripple oscillations (SPW-Rs). Furthermore, we found that CB1R activation reduces sharp wave-ripples by impairing the innate SPW-R-generating ability of the CA1 circuit.


Conflict of interest statement

The authors declare no competing interests.

Figures

Fig. 1
Fig. 1. T-DOpE probe and CA1 electrophysiological activity in response to local chemical manipulations under natural and optically stimulated conditions.
T-DOpE probes offer higher complexities at the sensing tip while easing the connection between the backend and the electronics. The probe is implanted into behaving head-fixed mice expressing channel rhodopsin (ChR2) in pyramidal neurons in hippocampal area CA1. Local infusion of synthetic cannabinoid (CB1 Agonist, CP-55,940) in CA1 is sufficient to abolish both spontaneous and optogenetically induced sharp wave-ripples (SPW-R) (Scale bar: 5 mm).
Fig. 2
Fig. 2. T-DOpE probe fabricated using thermal tapering process.
a Schematic of the preform fabrication. b Thermal drawing process pulling 30 mm diameter preform into 2 mm diameter fibers. The fibers are cut into 10 cm long mini-preforms for tapering (Scale bar: 2 cm) c Illustration of the thermal tapering process of mini preform. Similar to glass pipette pulling, the mini preform is heated until softened, pulled and cut at a desired angle, resulting in two individual probes. d Cross-sectional images of the three various designs. (i) Eight electrodes, one microfluidic channel, and one optical waveguide. (ii) Eight electrodes, eight microfluidic channels, and four optical waveguides. (iii) Twelve microfluidic channels and eight optical waveguides. (Scale bar: 50 µm).
Fig. 3
Fig. 3. T-DOpE probe connections and characterizations.
a Schematic of the T-DOpE probe backend connection process. b Photograph of a fully connected probe with eight electrodes, eight microfluidic channels, and four optical waveguides. (Scale bar: 5 mm) c Photograph of a straight probe and a probe bent roughly 45° to demonstrate the flexibility at the sensing end. d Impedance measurements of the BiSn electrodes before and after bending. All error bars and shaded colors represent the standard deviation. (Student’s two-tailed t-test, NS: not significant, p > 0.05 (After vs. Before, p = 0.3717, electrode numbers = 8)). Data are presented as mean ± SD. e Cross-sectional images to illustrate the individual addressability of the optical waveguides. (Scale bar: 50 µm) f Cartoon of green, blue, and orange food dye independently injected via the probe into a brain phantom. g Time-lapsed images to demonstrate the drug infusion in a 0.6% agarose gel. The inserted probe demonstrates the infusion of three different dyes at three different heights in the phantom. (Scale bar: 1 mm).
Fig. 4
Fig. 4. In vivo electrophysiology recording capabilities of T-DOpE probe.
a Schematic of the targeted implanted site, hippocampus CA1. b Example wideband (0.1–8000 Hz) extracellular traces obtained from CA1. (i) Enlarged trace to display multi-unit activity. (ii) An example trace of a sharp wave-ripple (100–250 Hz) dorsal to the pyramidal layer. (iii) An example of theta-nested gamma oscillations (6–11 Hz; 40–80 Hz). c Three example cells recorded on 8/9 and 9/21. Each cell is color coded to match the auto-correlations and the spike waveforms. *Peak in cross-correlation across the red and blue cells suggest their excitatory monosynaptic connection is maintained over 43 days.
Fig. 5
Fig. 5. In vivo modulation capabilities of T-DOpE probe: optogenetic and drug infusion.
a Example trace of wideband extracellular response to optical stimulation. b The firing rate of sorted cells during optical stimulation and the normalized firing rate across all sessions. c Examples of optically evoked responses with three levels of laser power. No response was observed in the cortex due to AAV-ChR2 expression localized to CA1. The amount of optically evoked neuron activity can be increased by varying the light output, allowing us to achieve optically induced SPW-Rs at higher laser powers. * shows spontaneous SPW-Rs in between optical stimulations. d Normalized firing rate of sorted cells in saline, vehicle, and drug+vehicle infusion. Note shortly after the infusion, the firing rate of all cells drastically decrease not due to pharmacological influence but to the physical displacement of the cells from the recording sites. e Spike amplitude of an interneuron and a pyramidal cell to demonstrate the recovery after infusion (200 nL; 1 nL s−1). Given the device tip contains both the microfluidic channel and recording sites (<20 µm in distance), the cells are pushed away and return after some period of time. f Average spike waveforms of the two cells before and after infusion. g Autocorrelation of the two cells before and after infusion.
Fig. 6
Fig. 6. CA1 theta power during running is reduced by pharmacological activation of CB1Rs expressed in CA1.
a Illustration of the experimental setup. A head-fixed, wild-type mouse is mounted on the wheel. A virtual reality environment is presented on the screen to instigate running, and the virtual position is recorded. Local infusion and neural recordings are achieved using the T-DOpE probe. b Power spectrogram of CP-55,940 infusion session in lower frequency bins (0–20 Hz). The upper panel shows the speed of the mouse. CP-55,940 (mg kg−1; 200 nL; 1 nL s−1) is locally infused at the recording sites after 60 min of baseline. c Representative normalized power spectrum of the baseline (Before infusion; duration: 60 min) and after CP-55,940 infusion (one hour after infusion; duration: 60 min) restricted to running time (>2 cm s−1 and >1 s running epochs). d Representative normalized power spectrum of the baseline (Before infusion; duration: 60 min) and after drug vehicle infusion (one hour after infusion; duration: 60 min) restricted to running time with the same criteria as above. e Comparison of the normalized theta power (6–11 Hz) between baseline and infused vehicle or drug (Paired two-sided t-test, NS: not significant p ≥ 0.05, *p ≤ 0.05 (Baseline vs. Drug Vehicle, p = 0.2737, animal number = 5), (Baseline vs. CP-55,940, p = 0.0026, animal number = 5)). Data are presented as mean ± SD.
Fig. 7
Fig. 7. SPW-R rate is lowered by pharmacological activation of CB1Rs expressed in CA1.
a Power spectrogram of CP-55,940 infusion session on higher frequency bins (100–300 Hz) with the same experimental set-up as Fig. 6a. The ripple rate is plotted on top of the spectrogram with respect to the same timescale. The upper panel shows the speed of the mouse. CP-55,940 (mg kg−1; 200 nL; 1 nL s−1) is locally infused at the recording sites after 60 min of baseline. b Ripple count per 10 min over 7-hour recording session. c Power spectrum of the baseline (Before infusion; duration: 60 min) and after CP-55,940 infusion (one hour after infusion; duration: 60 min). d Spectral difference from the baseline to the recording after CP-55,940 infusion. e Normalized ripple rate across all animals and sessions (drug vehicle and CP,55–940 infusion; animal number = 10). Data are presented as mean ± SEM. f Normalized ripple count between baseline and infused vehicle or drug (two-sided Wilcoxon Signed-rank test, *****p ≤ 0.00001, NA p > 0.05 (Baseline vs. VEH, p = 0.5857, animal number = 5), (Baseline vs. CP-55,940, p = 1.7333e-6, animal number = 5)). Data are presented as mean ± SEM.
Fig. 8
Fig. 8. Generation of SPW-Rs by optical stimulation of CA1 PYR is abolished by pharmacological activation of CA1 CB1Rs.
a Illustration of the experimental setup. A head-fixed AAV-CamKII-ChR2 mouse is mounted on the wheel. A virtual reality environment is presented on the screen to instigate running, and the virtual position is recorded. Local infusion, optical stimulation, and neural recording are achieved using the T-DOpE probe. b Power spectrogram of CP-55,940 infusion session on high frequency bins (100–300 Hz). Following 30 min of baseline, CA1 PYR are optical stimulated (n = 400 pulses of 150 ms at low, medium, and high power) over 40 min. CP-55,940 (mg kg−1; 200 nL; 1 nLs−1) is locally infused at the 80-minute mark. After the cells recover from the infusion, optical stimulation is repeated. c Representative response to low, medium, and high optical stimulations during the baseline and after CP-55,940 infusion. d Average neural response to the high optical stimulation during the baseline and after CP-55,940 infusion. Data are presented as mean ± SD. e Average Wavelet Transform of the activity in baseline and after drug infusion. f Spectrum of baseline and for CP-55,940 infusion during high pulses. g Spectral difference between the baseline and after CP-55,940 infusion for the optical pulses. h The averaged normalized spectrum (animal number = 4). Data are presented as mean ± SD. i The averaged spectral difference between the baseline and after CP-55,940 infusion for high optical pulses (animal number = 4). Data are presented as mean ± SD. j Normalized ripple rate during baseline and during optical stimulation. After the infusion, normalized ripple rate 30 min before and during optical stimulation. (two-sided Wilcoxon Signed-rank test, *****p ≤ 0.00001, (Baseline vs. CP-55,940, p = 1.8162e-5, animal number = 4), (Optical Stim vs. Optical Stim after CP-55,940, p = 8.2773e-6, animal number = 4)). Data are presented as mean ± SEM.

Similar articles

Cited by

References

    1. Buzsáki G. Large-scale recording of neuronal ensembles. Nat. Neurosci. 2004;7:446–451. doi: 10.1038/nn1233. - DOI - PubMed
    1. Steinmetz NA, et al. Neuropixels 2.0: a miniaturized high-density probe for stable, long-term brain recordings. Science. 2021;372:eabf4588. doi: 10.1126/science.abf4588. - DOI - PMC - PubMed
    1. Chung JE, et al. High-density, long-lasting, and multi-region electrophysiological recordings using polymer electrode arrays. Neuron. 2019;101:21–31.e25. doi: 10.1016/j.neuron.2018.11.002. - DOI - PMC - PubMed
    1. Ko, E., Vöröslakos, M., Buzsáki, G. & Yoon, E. flexLiTE: flexible micro-LED integrated optoelectrodes for minimally-invasive chronic deep-brain study. bioRxiv, 10.1101/2022.08.05.503006 (2022).
    1. Patel PR, et al. Chronic in vivo stability assessment of carbon fiber microelectrode arrays. J. Neural Eng. 2016;13:066002. doi: 10.1088/1741-2560/13/6/066002. - DOI - PMC - PubMed