. 2024 Feb 24;15(1):1715.
doi: 10.1038/s41467-024-45913-9.

Pore evolution mechanisms during directed energy deposition additive manufacturing

Affiliations

Pore evolution mechanisms during directed energy deposition additive manufacturing

Kai Zhang et al. Nat Commun. .

Abstract

Porosity in directed energy deposition (DED) deteriorates mechanical performances of components, limiting safety-critical applications. However, how pores arise and evolve in DED remains unclear. Here, we reveal pore evolution mechanisms during DED using in situ X-ray imaging and multi-physics modelling. We quantify five mechanisms contributing to pore formation, migration, pushing, growth, removal and entrapment: (i) bubbles from gas atomised powder enter the melt pool, and then migrate circularly or laterally; (ii) small bubbles can escape from the pool surface, or coalesce into larger bubbles, or be entrapped by solidification fronts; (iii) larger coalesced bubbles can remain in the pool for long periods, pushed by the solid/liquid interface; (iv) Marangoni surface shear flow overcomes buoyancy, keeping larger bubbles from popping out; and (v) once large bubbles reach critical sizes they escape from the pool surface or are trapped in DED tracks. These mechanisms can guide the development of pore minimisation strategies.


Conflict of interest statement

The authors declare no competing interests.

Figures

Fig. 1
Fig. 1. Dynamic bubble behaviour and mechanisms during DED.
a, b Radiographs with associated schematic showing a bubble formed from an argon pore inside a powder particle. Small bubbles are entrained in the recirculating flows in the melt pool. G represents gas, L represents liquid, S represents solid in the schematic. c, d Radiographs with associated schematic showing small bubbles coalescing into a larger bubble. Small bubbles often migrate from the front to the rear of the recirculating flows in the melt pool. e, f Radiographs with associated schematic showing a large bubble pushed by solid/liquid interface, growing as small bubbles coalesce into it. g, h Radiographs with associated schematic showing a large bubble entrained in the melt pool, prevented from bursting at the surface by the squeezed Marangoni shear flow. i, j Radiographs with associated schematic showing the large bubble (yellow circle) bursting at the melt pool surface after it reaches a critical size. k, l Radiographs with associated schematic showing the large bubble trapped by the solidification front when the laser is turned off. The substrate traverse speed is 2 mm s−1, the laser power is 160 W, layer 1. The laser beam in the X-ray radiographs and corresponding schematics are shown in red colour, and the laser beam location is nearly symmetrical to the melt pool geometry, while it is slightly in the forward of the centre due to the advection of heat. See the video corresponding to (a, c, e, g, i, k) in Supplementary Movie 1. Scale bars in radiographs: 300 μm.
Fig. 2
Fig. 2. Pore formation mechanisms during DED.
a Pore formation dynamics. Ai, a pore was captured to form in the melt pool from the porosity in the powder feedstock particle at a substrate traverse speed of 1 mm s−1, a laser power of 160 W, layer 3; Aii, a pore formed from a powder when the laser melts the powders at a substrate traverse speed of 1 mm s−1, a laser power of 160 W, layer 1. b Bi, a pore formed from the porosity in the previous layers. c Schematic illustration of the pore formation mechanism at a traverse speed of 1 mm s−1, a laser power of 160 W, layer 3. d Accumulative number of pores from powders and previous layers with increasing time in DED at a traverse speed of 1 mm s−1, a laser power of 160 W, layer 3. e Pore formation rate from porosity in powders and previous layers in DED at a traverse speed of 1 mm s−1, a laser power of 160 W, layer 3; a traverse speed of 2 mm s−1, a laser power of 160 W, layer 3, respectively. Error bars represent standard deviation. See the videos corresponding to (ac) in Supplementary Movies 2 and 3. Scale bars in (a, b) are 300 μm.
Fig. 3
Fig. 3. Quantification of the bubble growth mechanisms.
a Bubble growth over different building parameters. Bubble diameter changes were tracked with moving distance over the building process in the third layer of the build for a substrate traverse speed of 2 and 1 mm s−1, respectively. The laser power is 160 W. The bubble diameter error bars are calculated as ±2 pixels, equivalent to the segmentation uncertainty. b Radiograph examples at 2 and 1 mm s−1 are shown in 1a and 1b (scale bars are 300 μm), with the corresponding tomographic rendered images overlaid with the pore equivalent diameter. See the videos corresponding to (b) in Supplementary Movies 1 and 4. c Bubble growth over the building process in the first layer of build for a laser power of 150 and 100 W, respectively. The traverse speed is 1 mm s−1. d Bubble growth over different layers. Bubble diameter changes were tracked over different layers of the build, namely, layers 1–3, the laser power is 160 W, and the traverse speed is 1 mm s−1.
Fig. 4
Fig. 4. Bubble migration from front to back of the melt pool.
a The melt pool is divided into regions A (front), B (middle) and C (back). The location of point O in the left intersection of the solid/liquid/air boundary was regarded as the starting position (depth = 0, Width = 0). Laser power is 160 W and traverse speed is 2 mm s−1, layer 3. See the video in Supplementary Movie 5. b Motion track and velocity of the bubble circulation in region A, the velocity value is shown in the colour bar, and the arrow shows the moving direction. c Motion track and velocity of the bubble in region B. d Motion track and velocity of the bubble circulation in region C. The scale bars in (a) and inset figures in (bd) are 300 μm.
Fig. 5
Fig. 5. Bubble escape from the melt pool and entrapment by the solidification front.
a Motion track and velocity of a bubble escape following Marangoni flow. The velocity value is shown in the parula colourmap. The time is shown in the jet colourmap. See the video in Supplementary Movie 6. b Accumulative number of bubble escape, coalesce and are entrapped with increasing time, and it is fitted linearly. Entrapped bubbles are shown in the inset figure. c The rates of bubble escaped and entrapped in a traverse speed of 1 mm s−1, layer 1; 2 mm s−1, layer 1; 1 mm s−1, layer 3; 2 mm s−1, layer 3, respectively. Error bars represent standard deviation. d Accumulative number of bubble escape in total, front and back of melt pool. In (a, b, d), the laser power is 160 W and the traverse speed is 1 mm s−1, layer 3. Scale bars in (a, b) are 300 μm.
Fig. 6
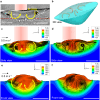
Fig. 6. Modelling results showing the melt pool flow without bubbles during DED.
a A X-ray image showing the melt pool. See the video in Supplementary Movie 2. b 3D view schematic showing the melt pool flow. c Side view and (d) corresponding 2D projected streamlines by modelling. e front view and (f) corresponding 2D projected streamlines by modelling. T in (cf) represents temperature in K. The traverse speed is 2 mm s−1, and the laser power is 160 W. Scale bars in (a) and (cf) are 300 μm.
Fig. 7
Fig. 7. Comparison between experimental data and modelling results of bubble coalescence, push-down and pop-up in the back of the melt pool.
a X-ray images and corresponding simulation images showing bubble coalescence at t = 0.45 ms and t = 0.51 ms (shown in the front and side view images) (see simulation images in Supplementary Fig. 9 and video in Supplementary Movie 7). b X-ray images and corresponding simulation images showing a large bubble pushed by Marangoni shear flow at t = 0.7 ms and t = 4.5 ms from bubble insertion t = 0 ms (shown in the side view image) (see simulation images in Supplementary Fig. 12 and video in Supplementary Movie 9). c X-ray images and corresponding simulation images showing the large bubble pop-up at t = 0.8 ms and t = 0.96 ms from bubble insertion t = 0 ms (shown in the side view image) (see simulation images in Supplementary Fig. 13). T in the colour bar represents temperature in K. Scale bars in (ac) are 300 μm.
Fig. 8
Fig. 8. Comparison between experimental data and modelling results of bubble migration in the melt pool.
a A radiograph showing melt pool with impacting powder. b For the forced case, the temperature field obtained by modelling with the same parameters as the X-ray imaging experiments, velocity and temperature perturbations given to the surface to simulate powder hitting effects, and (c) corresponding velocity and trace of a bubble inside the melt pool. The up-down migration of a bubble under forced oscillation on the surface, caused by the formation of circulation cells compared with the large Marangoni circulation shown in Fig. 6c, d. Modelling and experiment results are shown in blue and black lines, respectively. d Temperature field considering impacting powder at t, (e) formation of smaller cells at t + 0.2 ms. And (f) corresponding velocity and trace of a bubble inside the melt pool. The modelling and experimental curves are connected in black and blue lines, respectively. Direct simulation of random powder bombardment where sudden velocity increase is induced in the impact region, which causes irregular bubble migration such as the up-down migration and local circulation. Modelling and experiment results are shown in blue and black lines, respectively. For the forced case, the (circular) surface wave period is set as 0.6 ms, surface wave number is 5 in the pool lateral direction. For the direct bombardment case, the impacting velocity is 4 m s−1, the powder diameter is 90 µm, the impacting interval is 0.5 ms and the powder temperature is 1800 K for simplicity. These values for modelling are determined by the X-ray imaging experimental video. T in the colour bar in (b) and (d) represents temperature in K. The velocity unit in (b, d, e) is m s−1. Scale bars in (a, b, d, e) are 300 μm.

References

    1. DebRoy T, et al. Additive manufacturing of metallic components—process, structure and properties. Prog. Mater. Sci. 2018;92:112–224. doi: 10.1016/j.pmatsci.2017.10.001. - DOI
    1. Gu D, et al. Material-structure-performance integrated laser-metal additive manufacturing. Science. 2021;372:eabg1487. doi: 10.1126/science.abg1487. - DOI - PubMed
    1. Piscopo G, Iuliano L. Current research and industrial application of laser powder directed energy deposition. Int. J. Adv. Manuf. Technol. 2022;119:6893–6917. doi: 10.1007/s00170-021-08596-w. - DOI
    1. Sterling AJ, Torries B, Shamsaei N, Thompson SM, Seely DW. Fatigue behavior and failure mechanisms of direct laser deposited Ti-6Al-4V. Mater. Sci. Eng. A. 2016;655:100–112. doi: 10.1016/j.msea.2015.12.026. - DOI - PMC - PubMed
    1. Wolff, S. J. et al. In situ X-ray imaging of pore formation mechanisms and dynamics in laser powder-blown directed energy deposition additive manufacturing. Int. J. Mach. Tools Manuf. 166, 103743 (2021).