

Development of a CD8+ T cell associated signature for predicting the prognosis and immunological characteristics of gastric cancer by integrating single-cell and bulk RNA-sequencing
- PMID: 38402299
- PMCID: PMC10894294
- DOI: 10.1038/s41598-024-54273-9
Development of a CD8+ T cell associated signature for predicting the prognosis and immunological characteristics of gastric cancer by integrating single-cell and bulk RNA-sequencing
Abstract
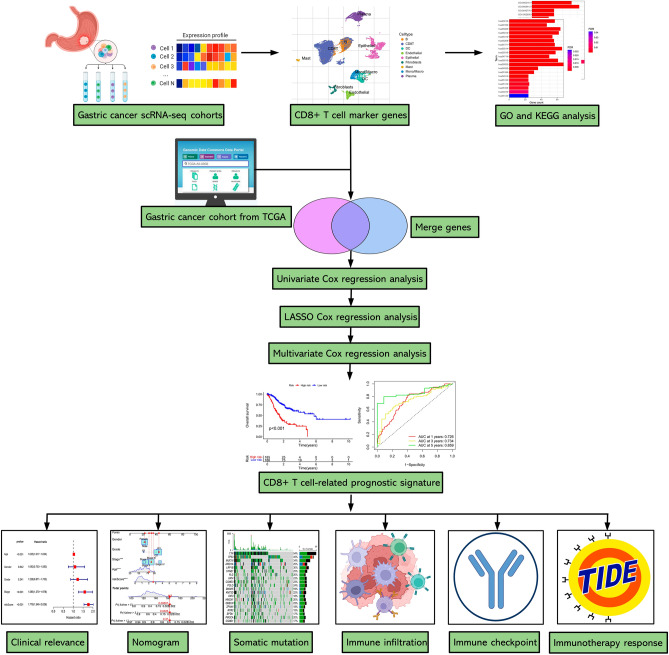
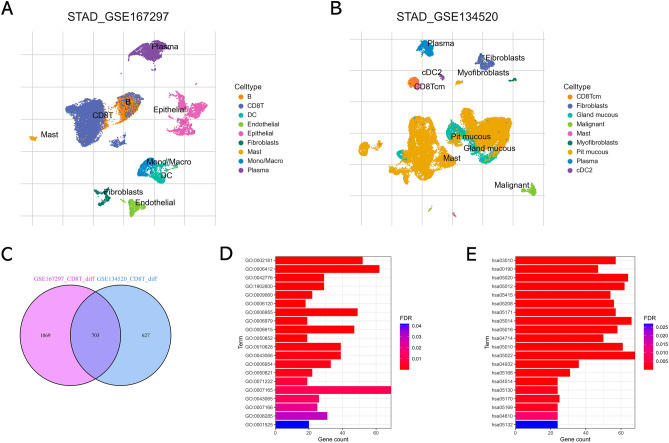
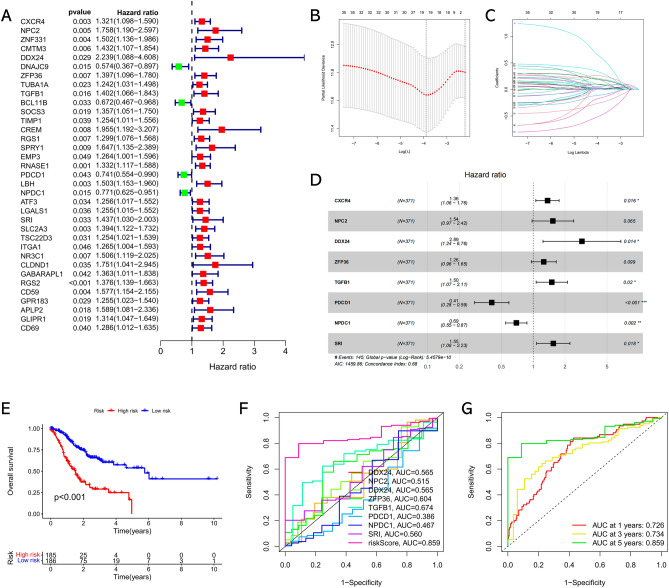
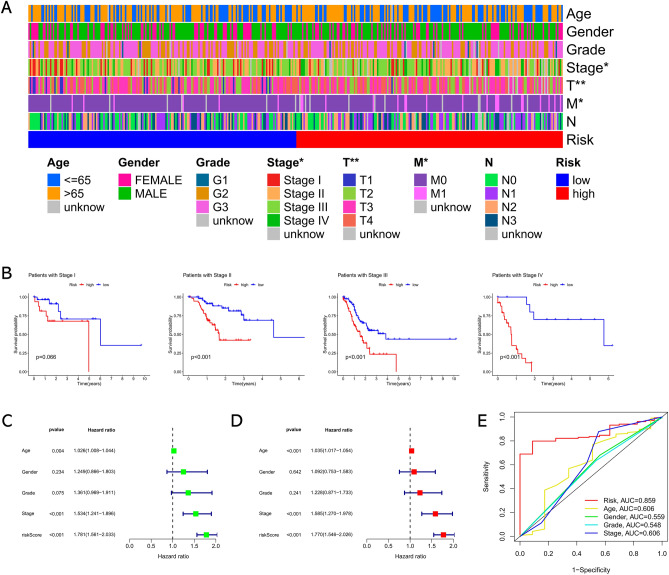
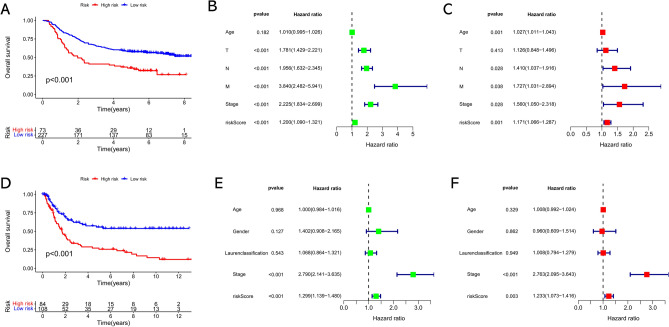
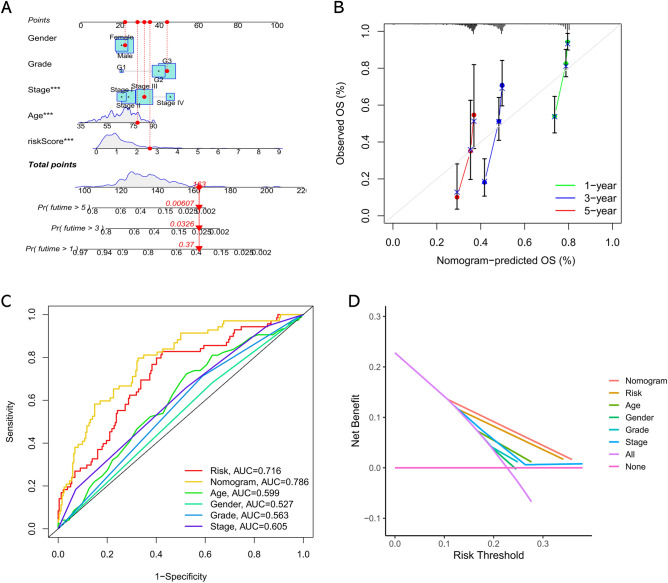
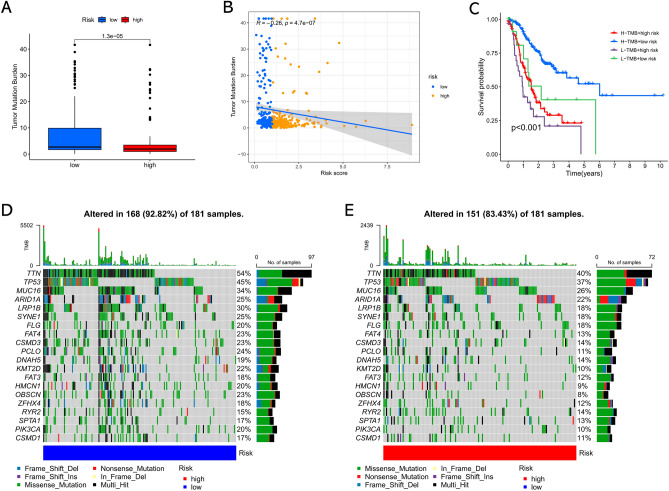
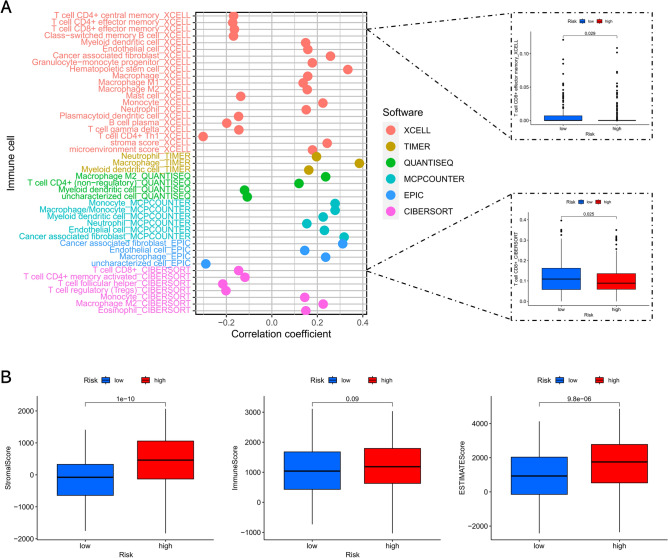
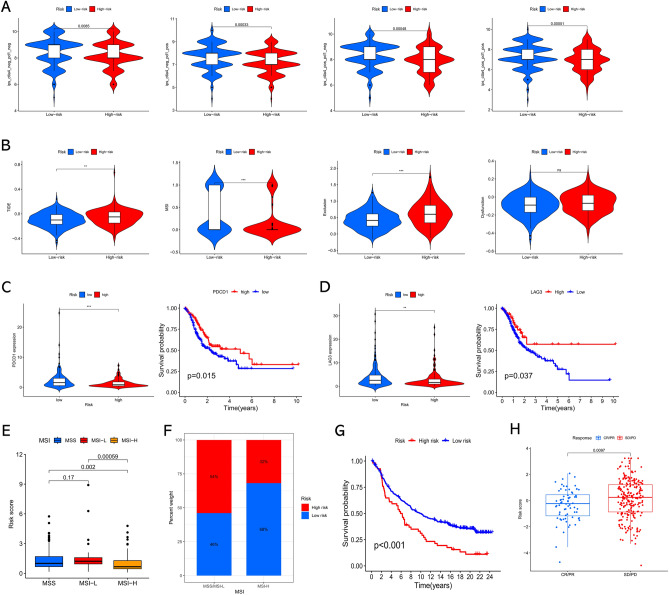
The universally poor clinical outcome makes gastric cancer (GC) still a significant public health threat, the main goal of our research is to develop a prognostic signature that can forecast the outcomes and immunological characteristics of GC via integrating single-cell and bulk RNA-sequencing. The CD8+ T cell feature genes were screened out by exploring single-cell RNA-sequencing (scRNA-seq) profiles retrieved from the TISCH2 database. Then, Cox and LASSO regressions were exploited for constructing a prognostic model in TCGA cohort based on these CD8+ T cell feature genes. Survival analysis was conducted to investigate the predictive capability of the signature for the clinical outcome of GC patients in TCGA and GEO cohorts. Additionally, we further examined the correlations between the risk signature and tumor immunotherapeutic response from the perspectives of immune infiltration, tumor mutation burden (TMB), immune checkpoint biomarker (ICB) expression, tumor microenvironment (TME), microsatellite instability (MSI), TIDE, and TCIA scores. In total, 703 CD8+ T cell feature genes were identified, eight of which were selected for constructing a prognostic signature. GC patients who possess high-risk score had significantly poorer survival outcomes than those who possess low-risk score in TCGA and GEO cohorts. Immune infiltration analysis proved that the risk score was negatively connected with the infiltration abundance of CD8+ T cells. Then, our findings demonstrated that GC patients in the high-risk subgroup possess a higher proportion of MSI-L/MSS, lower immune checkpoint biomarker expression, lower TMB, higher TIDE scores and lower TCIA scores compared to those in the low-risk subgroup. What's more, immunotherapy cohort analysis confirmed that patients who possess high-risk score are not sensitive to anti-cancer immunotherapy. Our study developed a reliable prognostic signature for GC that was significantly correlated with the immune landscape and immunotherapeutic responsiveness. The risk signature may guide clinicians to adopt more accurate and personalized treatment strategies for GC patients.
Keywords: Gastric cancer; Immune; Immunotherapy; Prognosis; Single-cell RNA-sequencing.
© 2024. The Author(s).
Conflict of interest statement
The authors declare no competing interests.
Figures
Similar articles
-
Combining single-cell sequencing data to construct a prognostic signature to predict survival, immune microenvironment, and immunotherapy response in gastric cancer patients.Front Immunol. 2022 Oct 10;13:1018413. doi: 10.3389/fimmu.2022.1018413. eCollection 2022. Front Immunol. 2022. PMID: 36300104 Free PMC article.
-
Integrated analysis of single-cell and bulk RNA-sequencing reveals a novel signature based on NK cell marker genes to predict prognosis and immunotherapy response in gastric cancer.Sci Rep. 2024 Apr 1;14(1):7648. doi: 10.1038/s41598-024-57714-7. Sci Rep. 2024. PMID: 38561388 Free PMC article.
-
Construction of a prognostic model for gastric cancer based on immune infiltration and microenvironment, and exploration of MEF2C gene function.BMC Med Genomics. 2025 Jan 14;18(1):13. doi: 10.1186/s12920-024-02082-4. BMC Med Genomics. 2025. PMID: 39810215 Free PMC article.
-
A novel necroptosis-related gene index for predicting prognosis and a cold tumor immune microenvironment in stomach adenocarcinoma.Front Immunol. 2022 Oct 27;13:968165. doi: 10.3389/fimmu.2022.968165. eCollection 2022. Front Immunol. 2022. PMID: 36389725 Free PMC article. Review.
-
Prognostic value of TIGIT in East Asian patients with solid cancers: A systematic review, meta-analysis and pancancer analysis.Front Immunol. 2022 Sep 21;13:977016. doi: 10.3389/fimmu.2022.977016. eCollection 2022. Front Immunol. 2022. PMID: 36211383 Free PMC article.
Cited by
-
A New Medical Evaluation for Gastric Cancer Patients to Increase the Success Rate of Immunotherapy: A 2024 Update.Pharmaceuticals (Basel). 2024 Aug 24;17(9):1121. doi: 10.3390/ph17091121. Pharmaceuticals (Basel). 2024. PMID: 39338286 Free PMC article. Review.
-
Molecular Mechanism for Malignant Progression of Gastric Cancer Within the Tumor Microenvironment.Int J Mol Sci. 2024 Oct 31;25(21):11735. doi: 10.3390/ijms252111735. Int J Mol Sci. 2024. PMID: 39519285 Free PMC article. Review.
-
Effect of conditioned medium from miRNA-34a transfected gastric cancer-associated fibroblast on peripheral blood mononuclear cells.BMC Immunol. 2025 Feb 25;26(1):9. doi: 10.1186/s12865-025-00688-6. BMC Immunol. 2025. PMID: 40000950 Free PMC article.
-
CD8+ T Cell Subsets as Biomarkers for Predicting Checkpoint Therapy Outcomes in Cancer Immunotherapy.Biomedicines. 2025 Apr 9;13(4):930. doi: 10.3390/biomedicines13040930. Biomedicines. 2025. PMID: 40299510 Free PMC article. Review.
-
Comprehensive multi-omics analysis reveals the prognostic and immune regulatory characteristics of the PTPN family in osteosarcoma.PLoS One. 2025 Jun 26;20(6):e0326872. doi: 10.1371/journal.pone.0326872. eCollection 2025. PLoS One. 2025. PMID: 40570022 Free PMC article.
References
MeSH terms
Substances
LinkOut - more resources
Full Text Sources
Medical
Research Materials
Miscellaneous
