. 2024 Feb 24;7(1):228.
doi: 10.1038/s42003-024-05912-4.

Delivery of loaded MR1 monomer results in efficient ligand exchange to host MR1 and subsequent MR1T cell activation

Affiliations

Delivery of loaded MR1 monomer results in efficient ligand exchange to host MR1 and subsequent MR1T cell activation

Corinna A Kulicke et al. Commun Biol. .

Abstract

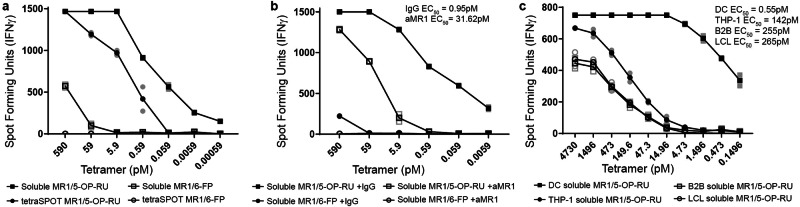
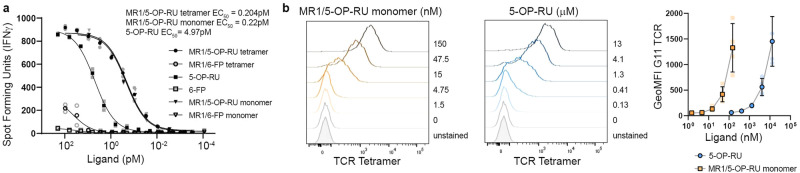
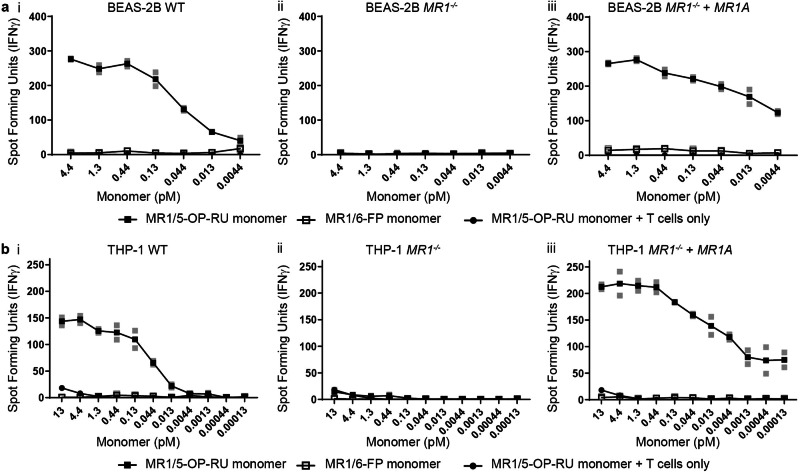
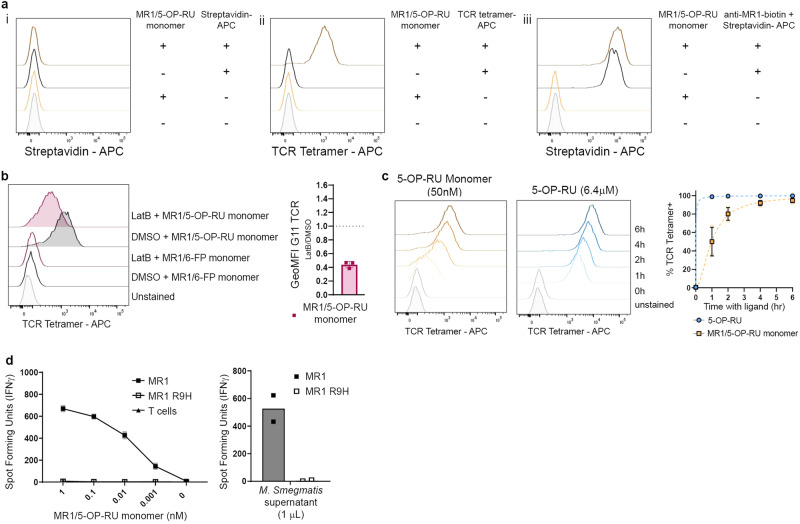
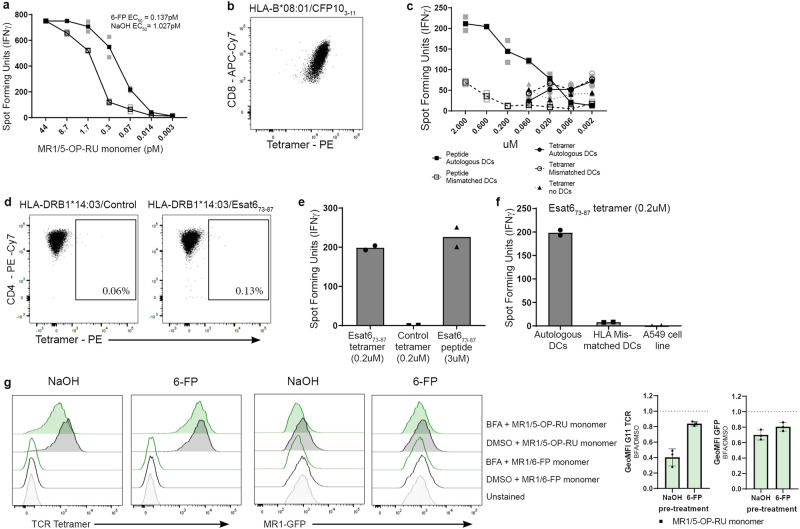
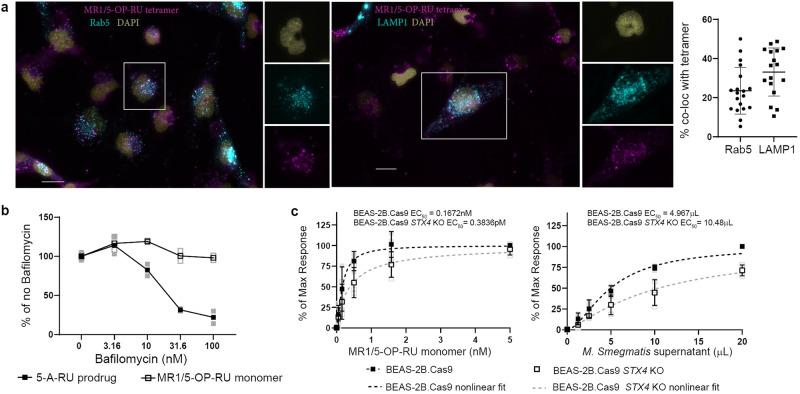
MR1-restricted T cells have been implicated in microbial infections, sterile inflammation, wound healing and cancer. Similar to other antigen presentation molecules, evidence supports multiple, complementary MR1 antigen presentation pathways. To investigate ligand exchange pathways for MR1, we used MR1 monomers and tetramers loaded with 5-(2-oxopropylideneamino)-6-d-ribitylaminouracil (5-OP-RU) to deliver the antigen. Using MR1-deficient cells reconstituted with wild-type MR1 or MR1 molecules that cannot bind 5-OP-RU, we show that presentation of monomer-delivered 5-OP-RU is dependent on cellular MR1 and requires the transfer of ligand from the soluble molecule onto MR1 expressed by the antigen presenting cell. This mode of antigen delivery strengthens the evidence for post-ER ligand exchange pathways for MR1, which could represent an important avenue by which MR1 acquires antigens derived from endocytosed pathogens.


Conflict of interest statement

The authors declare no competing interests.

Figures

Fig. 1
Fig. 1. MR1 ligands delivered to antigen presenting cells on soluble MR1 molecules are efficiently recognized by MR1T cell clones.
a MR1T cell clone (1e4 cells) IFN-γ responses to MR1/5-OP-RU or MR1/6-FP tetramer, either added to DCs (1e4 cells) (exSPOT) or bound to ELISPOT plate (tetraSPOT). b MR1T cell clone (1e4 cells) IFN-γ response to MR1/5-OP-RU is inhibited by anti-MR1 antibody blockade (aMR1, 2 μg/ml). c MR1T cell clone (1e4 cells) IFN-γ response to MR1/5-OP-RU tetramer, added to either DCs, THP-1 cells, BEAS-2B (B2B) cells or B-LCL (1e4 cells). EC50 calculated using non-linear regression and the difference in the EC50 was statistically significant between the curves (p < 0.0001) by the extra sum-of-squares F-test. Data are representative of n = 3 independent experiments each. Technical duplicates within the representative experiment are shown with a line connecting the mean. For EC50 values of replicate experiments see Supplementary Tables 1, 2.
Fig. 2
Fig. 2. Ligand delivered in the context of MR1 monomer is presented more efficiently than free ligand.
a MR1T cell clone (1e4 cells) IFN-γ response to DCs incubated with MR1/5-OP-RU tetramer, MR1/5-OP-RU monomer, and soluble 5-OP-RU. EC50 calculated using non-linear regression. The difference in the EC50 was statistically significant between the MR1/5-OP-RU tetramer and 5-OP-RU and between MR1/5-OP-RU monomer and 5-OP-RU curves (p < 0.0001), but there was no significant difference in the EC50 of MR1/5-OP-RU tetramer and monomer by the extra sum-of-squares F-test (p = 0.7486). Data are representative of n = 3 independent experiments. Technical duplicates within the representative experiment are shown with the mean and a line depicting the non-linear regression curve. For EC50 values of replicate experiments see Supplementary Table 3. b BEAS-2B.MR1-GFP cells were incubated with the indicated concentrations of MR1/5-OP-RU monomer or free 5-OP-RU overnight and surface stained for flow cytometry with APC-conjugated TCR tetramer. Representative histograms are shown with pooled geometric mean fluorescence intensity (GeoMFI) from n = 4 experiments. The same unstained and untreated control are shown in both histogram plots for easy comparison. Error bars denote SD of the mean of pooled experiments which are shown individually in lighter colors.
Fig. 3
Fig. 3. Presentation of MR1 ligands delivered on soluble MR1 molecules requires cellular MR1.
a MR1T cell clone (1e3 cells) IFN-γ response to BEAS-2B, BEAS-2B MR1-/- and BEAS-2B MR1-/- : MR1A (1e4 cells) incubated with MR1/5-OP-RU or MR1/6-FP monomers. Also included MR1T clone IFN-γ response to MR1/5-OP-RU monomer only with no antigen presenting cells. b Same as (a), except the antigen presenting cells are THP-1, THP-1 MR1-/- and THP-1 MR1-/- : MR1A (1e4 cells). Data are representative of n = 2 independent experiments. Technical duplicates within the representative experiment are shown with a line connecting the mean.
Fig. 4
Fig. 4. Ligands are transferred from the soluble MR1 molecules onto cellular MR1.
a BEAS-2B.MR1-GFP cells (3e5 cells) were pre-incubated with 50 nM of MR1/5-OP-RU monomer overnight before staining with either Streptavidin (i), TCR tetramer (ii) or biotinylated 26.5 anti-MR1 antibody followed by Streptavidin (iii). The same unstained sample is shown in all panels and the same primary antibody only controls are shown in (i) and (iii) for easy comparison. Data are representative of n = 3 independent experiments. b BEAS-2B.MR1-GFP cells were pre-incubated with 10 μM of latrunculin B (LatB) for 1 h before addition of MR1/5-OP-RU or MR1/6-FP monomer for an additional 4 h. Cells were surface stained with TCR tetramer. Representative histograms are shown with pooled geometric mean fluorescence intensity (GeoMFI) from n = 3 experiments. The same unstained and untreated control are shown in both histogram plots for easy comparison. Error bars denote SD. Bar denotes mean. c BEAS-2B.MR1-GFP cells were incubated with either 50 nM MR1/5-OP-RU monomer or 6.4 μM of free 5-OP-RU for indicated amounts of time before surface staining for flow cytometry with TCR tetramer. Representative histograms are shown with pooled geometric mean fluorescence intensity (GeoMFI) from n = 3 experiments. Error bars denote SD of the mean of pooled experiments which are shown individually in lighter colors. d MR1T cell clone (1e3 cells) IFN-γ response to BEAS-2B MR1-/- cells (1e4 cells) that had been transfected with the pCI AscI MR1 res or pCI AscI MR1 R9H res plasmid, followed by addition of the MR1/5-OP-RU monomer, or 1 μL of M. smegmatis supernatant. Data are representative of n = 3 independent experiments. Technical duplicates within the representative experiment are shown with a line connecting the mean.
Fig. 5
Fig. 5. Ligand exchange can occur in post-ER compartments.
a MR1T cell clone (1e4 cells) IFN-γ response to BEAS-2B.MR1-GFP (1e4 cells) that were pretreated with 6-FP vs NaOH using MR1/5-OP-RU monomer as the antigen. EC50 calculated using non-linear regression and the difference in the EC50 was statistically significant between the curves (p < 0.0001) by the extra sum-of-squares F-test. For EC50 values of replicate experiments see Supplementary Table 4. b HLA*B08:01-restricted T cell clone D480-F6 was stained with the HLA-B*08:01 tetramer to CFP103-11, along with antibodies to CD3, CD4, CD8 and a live/dead discriminator. Live, CD3+CD4-CD8+ T cells are shown. c HLA*B08:01-restricted T cell clone D480-F6 (5e3 cells) IFN-γ response to DCs (1e4 cells) that were incubated with either the CFP103-11 tetramer or CFP103-11 peptide. 9.5e4 irrelevant T cells (MR1-restricted D426-G11) were also added to the well to decrease T:T presentation of the classical T cell clone. d MHC II-restricted T cell clone D481-D1 was stained with the HLA-DRB1*14:03 tetramer to Esat673-87 or a control tetramer along with antibodies to CD3, CD4, CD8 and a live/dead discriminator. Live, CD3+CD8-CD4+ T cells are shown. e MHC II-restricted T cell clone D481-D1 (2e4 cells) IFN-γ response to D481 (autologous) dendritic cells (2e4 cells) that were incubated with either the Esat673-87 tetramer, control tetramer or Esat673-87 peptide. f MHC II-restricted D481-D1 T cell clone (2e4 cells) IFN-γ response to D481 (autologous) DCs, D520 mismatched dendritic cells or A549 cells (2e4 cells) that were incubated with the Esat673-87 tetramer. g BEAS-2B.MR1-GFP cells were pre-incubated with 6-FP or NaOH overnight. 6-FP was washed off and cells were incubated with 50 ug/ml brefeldin A (BFA) for 1 h before addition of MR1/5-OP-RU or MR1/6-FP monomer for an additional 4 h. Cells were surface stained for flow cytometry with TCR tetramer. Representative histograms are shown with pooled geometric mean fluorescence intensity (GeoMFI) from n = 3 experiments. The same unstained control is shown in all plots. Error bars denote SD. Bars denote mean. Data in (a), (c), (e) and (f) are representative of n = 3 independent experiments. In (a) and (c) technical duplicates within the representative experiment are shown with a line connecting the mean. In (e) and (f) technical duplicates witin the representative experiment are shown with the bar showing the mean.
Fig. 6
Fig. 6. Ligand exchange does not require acidification.
a BEAS-2B cells (1e5 or 1e4 cells) were seeded on chamber slides and CellLight RFP reagents for Rab5 and LAMP1 were added and incubated for 18 h at 37 C. Tetramer was then added for 2 h at room temperature, followed by washing 2X in PBS. All images acquired were using the same microscope settings. Data are representative of n = 3 independent experiments. Error bars denote SD of n = 19 cells for Rab5 and n = 17 cells for LAMP1 from a representative experiment. Scale bar denotes 20 μm. b MR1T cell clone (5e3 cells) IFN-γ response to BEAS-2B (1e4 cells) pre-treated with Bafilomycin A1 for 2 h, followed by addition of the MR1/5-OP-RU monomer or 5-OP-RU prodrug. Data are representative of n = 3 independent experiments. Technical duplicates within the representative experiment are shown with a line connecting the mean. c MR1T cell clone (1e3 cells) IFN-γ response to BEAS-2B.Cas9 or BEAS-2B.Cas9 STX4 KO cells (1e4) in the presence of the indicated concentrations of M. smegmatis supernatant or MR1/5-OP-RU monomer. Data were normalized to the maximum response and pooled from n = 3 independent experiments. Error bars denote SD of the mean of pooled experiments which are shown individually in lighter colors. EC50 calculated using non-linear regression and the difference in the EC50 was statistically significant between the curves (p = 0.0032) by the extra sum-of-squares F-test.

References

    1. Crowther MD, Sewell AK. The burgeoning role of MR1-restricted T-cells in infection, cancer and autoimmune disease. Curr. Opin. Immunol. 2021;69:10–17. doi: 10.1016/j.coi.2020.12.002. - DOI - PubMed
    1. Hinks TSC, Zhang XW. MAIT Cell activation and functions. Front. Immunol. 2020;11:1014. doi: 10.3389/fimmu.2020.01014. - DOI - PMC - PubMed
    1. Trowitzsch S, Tampé R. Multifunctional chaperone and quality control complexes in adaptive immunity. Annu. Rev. Biophys. 2020;49:135–161. doi: 10.1146/annurev-biophys-121219-081643. - DOI - PubMed
    1. Alvaro-Benito M, Freund C. Revisiting nonclassical HLA II functions in antigen presentation: peptide editing and its modulation. HLA. 2020;96:415–429. doi: 10.1111/tan.14007. - DOI - PubMed
    1. Moody DB, Cotton RN. Four pathways of CD1 antigen presentation to T cells. Curr. Opin. Immunol. 2017;46:127–133. doi: 10.1016/j.coi.2017.07.013. - DOI - PMC - PubMed

Publication types

MeSH terms