

Optimizing warfarin dosing for patients with atrial fibrillation using machine learning
- PMID: 38402362
- PMCID: PMC10894214
- DOI: 10.1038/s41598-024-55110-9
Optimizing warfarin dosing for patients with atrial fibrillation using machine learning
Abstract
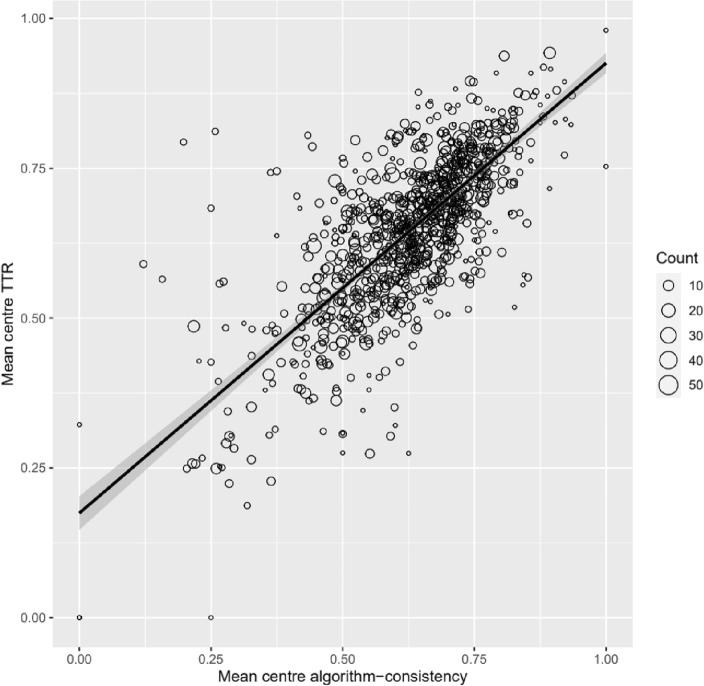
While novel oral anticoagulants are increasingly used to reduce risk of stroke in patients with atrial fibrillation, vitamin K antagonists such as warfarin continue to be used extensively for stroke prevention across the world. While effective in reducing the risk of strokes, the complex pharmacodynamics of warfarin make it difficult to use clinically, with many patients experiencing under- and/or over- anticoagulation. In this study we employed a novel implementation of deep reinforcement learning to provide clinical decision support to optimize time in therapeutic International Normalized Ratio (INR) range. We used a novel semi-Markov decision process formulation of the Batch-Constrained deep Q-learning algorithm to develop a reinforcement learning model to dynamically recommend optimal warfarin dosing to achieve INR of 2.0-3.0 for patients with atrial fibrillation. The model was developed using data from 22,502 patients in the warfarin treated groups of the pivotal randomized clinical trials of edoxaban (ENGAGE AF-TIMI 48), apixaban (ARISTOTLE) and rivaroxaban (ROCKET AF). The model was externally validated on data from 5730 warfarin-treated patients in a fourth trial of dabigatran (RE-LY) using multilevel regression models to estimate the relationship between center-level algorithm consistent dosing, time in therapeutic INR range (TTR), and a composite clinical outcome of stroke, systemic embolism or major hemorrhage. External validation showed a positive association between center-level algorithm-consistent dosing and TTR (R2 = 0.56). Each 10% increase in algorithm-consistent dosing at the center level independently predicted a 6.78% improvement in TTR (95% CI 6.29, 7.28; p < 0.001) and a 11% decrease in the composite clinical outcome (HR 0.89; 95% CI 0.81, 1.00; p = 0.015). These results were comparable to those of a rules-based clinical algorithm used for benchmarking, for which each 10% increase in algorithm-consistent dosing independently predicted a 6.10% increase in TTR (95% CI 5.67, 6.54, p < 0.001) and a 10% decrease in the composite outcome (HR 0.90; 95% CI 0.83, 0.98, p = 0.018). Our findings suggest that a deep reinforcement learning algorithm can optimize time in therapeutic range for patients taking warfarin. A digital clinical decision support system to promote algorithm-consistent warfarin dosing could optimize time in therapeutic range and improve clinical outcomes in atrial fibrillation globally.
© 2024. The Author(s).
Conflict of interest statement
Dr. Petch reports research support from Roche Canada. Mr. Nelson has nothing to disclose. Ms. Wu has nothing to disclose. Ms. Di has nothing to disclose. Dr. Carnicelli is supported by grant funding from the National Institutes of Health (5T32HL069749-17). Dr. Ghassemi has nothing to disclose. Dr. Benz has nothing to disclose. Dr. Fatemi is an employee of Microsoft Research. Dr. Granger reports research grants/contracts from AKROS, Apple, AstraZeneca, Boehringer Ingelheim, Bristol Myers Squibb, Daiichi Sankyo, Duke Clinical Research Institute, US Food and Drug Administration, Glaxosmithkline, Janssen Pharmaceutica, Medtronic Foundation, Novartis, and Pfizer; Consulting from Abbvie, Bayer, Boehringer Ingelheim, Boston Scientific, Bristol Myers Squibb, CeleCor Therapeutics, Correvio, Espero BioPharma, Janssen, Medscape, Medtronic LLC, Medtronic Inc, Merck, National Institute of Health, Novo Nordisk, Novartis, Pfizer, Rhoshan Pharmaceuticals, and Roche Diagnostics. Dr. Giugliano reports research support from Amgen and Anthos Therapeutics; Honoraria for CME lectures from Amgen, Daiichi Sankyo, and Servier; Consultant fees from Amarin, American College of Cardiology, Amgen, Astra Zeneca, CryoLife, CVS Caremark, Daiichi Sankyo, Esperion, Gilead, Glaxosmithkline, SAJA Pharmaceuticals, Samsung, and Servier. Dr. Hong has nothing to disclose. Dr. Patel reports receiving research grants/contracts from AstraZeneca, Bayer, and Janssen Research and Development; Funding through Duke for educational activities from AstraZeneca and Janssen Research and Development; Consulting from AstraZeneca, Bayer, and the Thrombosis Research Institute. Dr. Wallentin reports grants from AstraZeneca, Bristol-Myers Squibb/Pfizer, GlaxoSmithKline, Merck & Co, Boehringer Ingelheim, and Roche Diagnostics; Personal fees from Abbott. Dr. Wallentin has a patent (EP2047275B1) licensed to Roche Diagnostics and a patent (US8951742B2) licensed to Roche Diagnostics. Dr. Eikelboom reports consulting/honoraria support from Astra-Zeneca, Bayer, Boehringer-Ingelheim, Bristol-Myer-Squibb, Daiichi-Sankyo, Eli-Lilly, Glaxo-Smith-Kline, Pfizer, Janssen, Sanofi-Aventis, Servier and grant support from Astra-Zeneca, Bayer, Boehringer-Ingelheim, Bristol-Myer-Squibb, Glaxo-Smith-Kline, Pfizer, Janssen, Sanofi-Aventis. Dr. Connolly reports research support and honoraria for consulting and lectures from Portola, BMS, Pfizer, Javelin, Boehringer Ingelheim, Bayer, Daiichi Sankyo, and Abbott.
Figures
Similar articles
-
Variation in warfarin dose adjustment practice is responsible for differences in the quality of anticoagulation control between centers and countries: an analysis of patients receiving warfarin in the randomized evaluation of long-term anticoagulation therapy (RE-LY) trial.Circulation. 2012 Nov 6;126(19):2309-16. doi: 10.1161/CIRCULATIONAHA.112.101808. Epub 2012 Oct 1. Circulation. 2012. PMID: 23027801 Clinical Trial.
-
Novel oral anticoagulants for stroke prevention in atrial fibrillation: focus on apixaban.Adv Ther. 2012 Jun;29(6):491-507. doi: 10.1007/s12325-012-0026-8. Epub 2012 Jun 7. Adv Ther. 2012. PMID: 22684583 Review.
-
Comparative efficacy and safety of new oral anticoagulants in patients with atrial fibrillation.Circ Cardiovasc Qual Outcomes. 2012 Jul 1;5(4):480-6. doi: 10.1161/CIRCOUTCOMES.112.965988. Epub 2012 Jul 10. Circ Cardiovasc Qual Outcomes. 2012. PMID: 22787066 Free PMC article.
-
Comparison of the cost-effectiveness of new oral anticoagulants for the prevention of stroke and systemic embolism in atrial fibrillation in a UK setting.Clin Ther. 2014 Dec 1;36(12):2015-2028.e2. doi: 10.1016/j.clinthera.2014.09.015. Epub 2014 Oct 23. Clin Ther. 2014. PMID: 25438722
-
Periprocedural Outcomes of Direct Oral Anticoagulants Versus Warfarin in Nonvalvular Atrial Fibrillation.Circulation. 2018 Oct 2;138(14):1402-1411. doi: 10.1161/CIRCULATIONAHA.117.031457. Circulation. 2018. PMID: 29794081
Cited by
-
Implementation of deep reinforcement learning models for emotion detection and personalization of learning in hybrid educational environments.Front Artif Intell. 2024 Nov 28;7:1458230. doi: 10.3389/frai.2024.1458230. eCollection 2024. Front Artif Intell. 2024. PMID: 39668890 Free PMC article.
-
Reinforcement Learning and Its Clinical Applications Within Healthcare: A Systematic Review of Precision Medicine and Dynamic Treatment Regimes.Healthcare (Basel). 2025 Jul 19;13(14):1752. doi: 10.3390/healthcare13141752. Healthcare (Basel). 2025. PMID: 40724777 Free PMC article. Review.
-
Application of machine learning techniques for warfarin dosage prediction: a case study on the MIMIC-III dataset.PeerJ Comput Sci. 2025 Jan 2;11:e2612. doi: 10.7717/peerj-cs.2612. eCollection 2025. PeerJ Comput Sci. 2025. PMID: 39896040 Free PMC article.
References
-
- World Health Statistics 2021: Monitoring Health for the SDGs, Sustainable Development Goals. (World Health Organization, Geneva, 2021).
MeSH terms
Substances
LinkOut - more resources
Full Text Sources
Medical
Research Materials
Miscellaneous
