

Phenotypes of osteoarthritis-related knee pain and their transition over time: data from the osteoarthritis initiative
- PMID: 38402384
- PMCID: PMC10893610
- DOI: 10.1186/s12891-024-07286-4
Phenotypes of osteoarthritis-related knee pain and their transition over time: data from the osteoarthritis initiative
Abstract
Background: Identification of knee osteoarthritis (OA) pain phenotypes, their transition patterns, and risk factors for worse phenotypes, may guide prognosis and targeted treatment; however, few studies have described them. We aimed to investigate different pain phenotypes, their transition patterns, and potential risk factors for worse pain phenotypes.
Methods: Utilizing data from the Osteoarthritis Initiative (OAI), pain severity was assessed using the Western Ontario and McMaster Universities Osteoarthritis Index (WOMAC) pain subscale. We identified the activity-related pain phenotypes and estimated the transition probabilities of pain phenotypes from baseline to the 24-month using latent transition analysis. We examined the risk factors at baseline with the 24-month pain phenotypes and the transition of pain phenotypes.
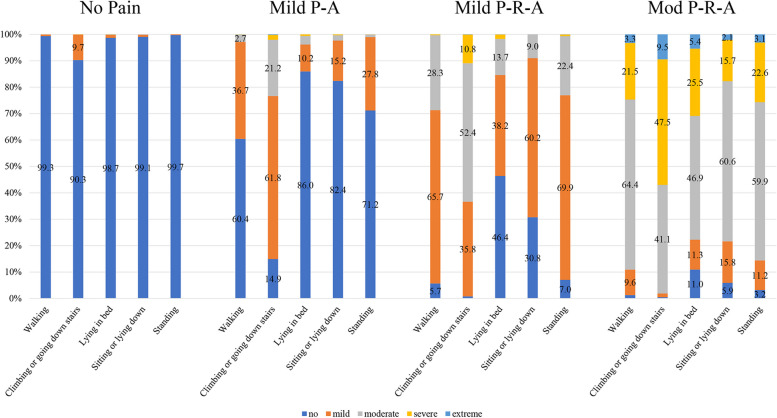
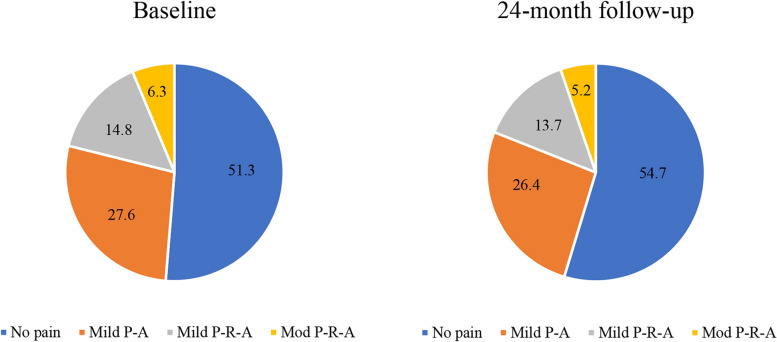
Results: In 4796 participants, we identified four distinct knee pain phenotypes at both baseline and 24-month follow-up: no pain, mild pain during activity (Mild P-A), mild pain during both rest and activity (Mild P-R-A), and moderate pain during both rest and activity (Mod P-R-A). 82.9% knees with no pain at baseline stayed the same at 24-month follow-up, 17.1% progressed to worse pain phenotypes. Among "Mild P-A" at baseline, 32.0% converted to no-pain, 12.8% progressed to "Mild P-R-A", and 53.2% remained. Approximately 46.1% of "Mild P-R-A" and 54.5% of "Mod P-R-A" at baseline experienced remission by 24-month. Female, non-whites, participants with higher depression score, higher body mass index (BMI), higher Kellgren and Lawrence (KL) grade, and knee injury history were more likely to be in the worse pain phenotypes, while participants aged 65 years or older and with higher education were less likely to be in worse pain phenotypes at 24-month follow-up visit. Risk factors for greater transition probability to worse pain phenotypes at 24-month included being female, non-whites, participants with higher depression score, higher BMI, and higher KL grade.
Conclusions: We identified four distinct knee pain phenotypes. While the pain phenotypes remained stable in the majority of knees over 24 months period, substantial proportion of knees switched to different pain phenotypes. Several socio-demographics as well as radiographic lesions at baseline are associated with worse pain phenotypes at 24-month follow-up visit and transition of pain phenotypes.
Keywords: Osteoarthritis; Pain; Phenotype; Risk factors.
© 2024. The Author(s).
Conflict of interest statement
The authors declare no competing interests.
Figures

Similar articles
-
Trajectories and risk profiles of pain in persons with radiographic, symptomatic knee osteoarthritis: data from the osteoarthritis initiative.Osteoarthritis Cartilage. 2014 May;22(5):622-30. doi: 10.1016/j.joca.2014.03.009. Epub 2014 Mar 21. Osteoarthritis Cartilage. 2014. PMID: 24662734 Free PMC article.
-
Natural history of pain and disability among African-Americans and Whites with or at risk for knee osteoarthritis: A longitudinal study.Osteoarthritis Cartilage. 2018 Apr;26(4):471-479. doi: 10.1016/j.joca.2018.01.020. Epub 2018 Feb 2. Osteoarthritis Cartilage. 2018. PMID: 29408279 Free PMC article.
-
OA phenotypes, rather than disease stage, drive structural progression--identification of structural progressors from 2 phase III randomized clinical studies with symptomatic knee OA.Osteoarthritis Cartilage. 2015 Apr;23(4):550-8. doi: 10.1016/j.joca.2014.12.024. Epub 2015 Jan 8. Osteoarthritis Cartilage. 2015. PMID: 25576879 Clinical Trial.
-
Knee Flexion Contractures Are Associated with Worse Pain, Stiffness, and Function in Patients with Knee Osteoarthritis: Data from the Osteoarthritis Initiative.PM R. 2021 Sep;13(9):954-961. doi: 10.1002/pmrj.12497. Epub 2020 Nov 10. PM R. 2021. PMID: 32969154
-
Biclustering reveals potential knee OA phenotypes in exploratory analyses: Data from the Osteoarthritis Initiative.PLoS One. 2022 May 24;17(5):e0266964. doi: 10.1371/journal.pone.0266964. eCollection 2022. PLoS One. 2022. PMID: 35609053 Free PMC article.
Cited by
-
Antidepressants to Manage Osteoarthritic Pain: The Value of Pain Phenotyping.Drugs Aging. 2025 Mar;42(3):183-193. doi: 10.1007/s40266-025-01182-9. Epub 2025 Feb 20. Drugs Aging. 2025. PMID: 39976814 Free PMC article. Review.
References
-
- Felson DT, Zhang Y. An update on the epidemiology of knee and hip osteoarthritis with a view to prevention. Arthritis Rheum. 1998;41(8):1343–1355. - PubMed
-
- Hutchings A, Calloway M, Choy E, Hooper M, Hunter DJ, Jordan JM, et al. The longitudinal examination of arthritis pain (LEAP) study: relationships between weekly fluctuations in patient-rated joint pain and other health outcomes. J Rheumatol. 2007;34(11):2291–2300. - PubMed
-
- Hunter DJ, Bierma-Zeinstra S. Osteoarthritis. Lancet. 2019;393(10182):1745–1759. - PubMed
-
- Oo WM, Yu SP, Daniel MS, Hunter DJ. Disease-modifying drugs in osteoarthritis: current understanding and future therapeutics. Expert Opin Emerg Drugs. 2018;23(4):331–347. - PubMed
-
- Pan F, Jones G. Clinical perspective on pain and pain phenotypes in osteoarthritis. Curr Rheumatol Rep. 2018;20(12):79. - PubMed
MeSH terms
LinkOut - more resources
Full Text Sources
Research Materials
