. 2024 Feb 24;24(1):48.
doi: 10.1186/s12874-024-02180-y.

A parametric additive hazard model for time-to-event analysis

Affiliations

A parametric additive hazard model for time-to-event analysis

Dina Voeltz et al. BMC Med Res Methodol. .

Abstract

Background: In recent years, the use of non- and semi-parametric models which estimate hazard ratios for analysing time-to-event outcomes is continuously criticized in terms of interpretation, technical implementation, and flexibility. Hazard ratios in particular are critically discussed for their misleading interpretation as relative risks and their non-collapsibility. Additive hazard models do not have these drawbacks but are rarely used because they assume a non- or semi-parametric additive hazard which renders computation and interpretation complicated.

Methods: As a remedy, we propose a new parametric additive hazard model that allows results to be reported on the original time rather than on the hazard scale. Being an essentially parametric model, survival, hazard and probability density functions are directly available. Parameter estimation is straightforward by maximizing the log-likelihood function.

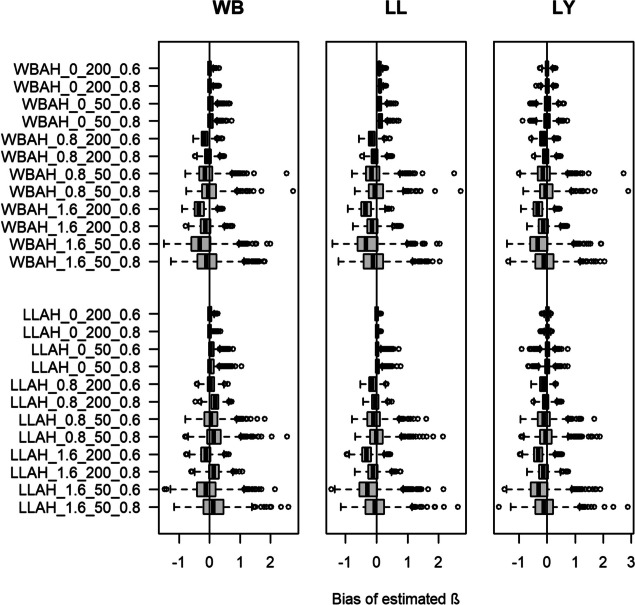
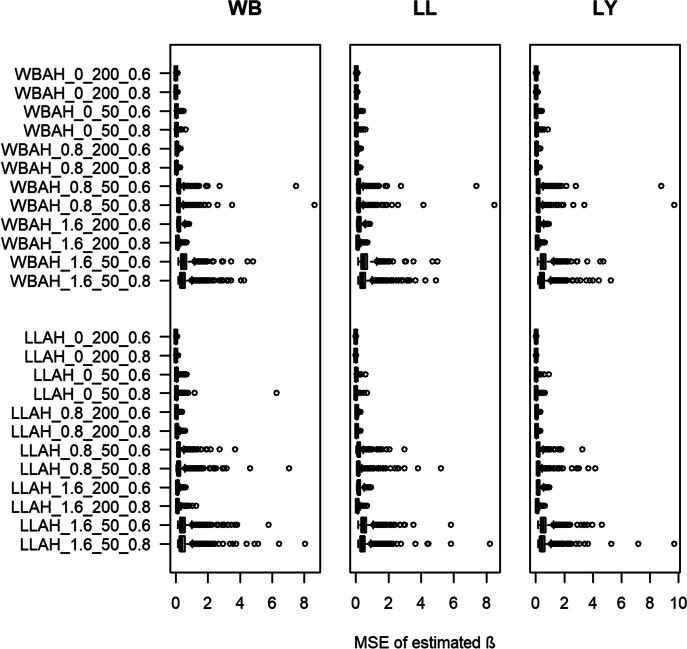
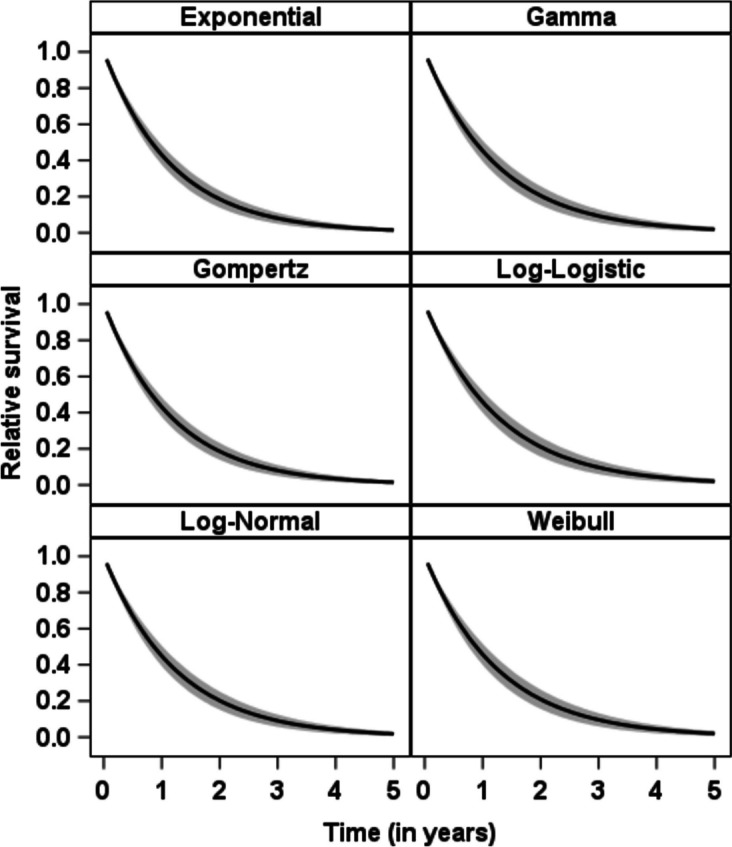
Results: Applying the model to different parametric distributions in a simulation study and in an exemplary application using data from a study investigating medical care to lung cancer patients, we show that the approach works well in practice.

Conclusions: Our proposed parametric additive hazard model can serve as a powerful tool to analyze time-to-event outcomes due to its simple interpretation, flexibility and facilitated parameter estimation.

Keywords: Additive hazard; Parametric modeling; Survival analysis; Time-to-event model.


Conflict of interest statement

Competing interests. The authors declare no competing interests.

Figures

Fig. 1
Fig. 1
Box plots of estimated median bias for the regression coefficient β over 1000 simulations for each setting. Y-axis denotes each setting with an ID consisting of the abbreviated true model (WBAH = Weibull additive hazard, LLAH = Log-Logistic additive hazard), the true β, the number of participants per study and number of events (e.g., Weibull additive hazard model, true β=0, number of patients =50, number of events = 60% results in “WBAH_0_50_0.6”). Left-most plot shows results for the Weibull (WB) additive hazard model, middle plot shows results for the Log-Logistic (LL) additive hazard model and right plot shows results for the Lin-Ying (LY) model
Fig. 2
Fig. 2
Box plots of estimated median mean squared error (MSE) for the regression coefficient β over 1000 simulations for each setting. Y-axis denotes each setting with an ID consisting of the abbreviated true model (WBAH = Weibull additive hazard, LLAH = Log-Logistic additive hazard), the true β, the number of participants per study and number of events (e.g., Weibull additive hazard model, true β=0, number of patients =50, number of events = 60% results in “WBAH_0_50_0.6”). Left-most plot shows results for the Weibull (WB) additive hazard model, middle plot shows results for the Log-Logistic (LL) additive hazard model and right plot shows results for the Lin-Ying (LY) model
Fig. 3
Fig. 3
Bar plot showing relative frequency of coverage for the regression coefficient β over 1000 simulations for each setting. Y-axis denotes each setting with an ID consisting of the abbreviated true model (WBAH = Weibull additive hazard, LLAH = Log-Logistic additive hazard), the true β, the number of participants per study and number of events (e.g., Weibull additive hazard model, true β=0, number of patients =50, number of events = 60% results in “WBAH_0_50_0.6”). Left-most plot shows results for the Weibull (WB) additive hazard model, middle plot shows results for the Log-Logistic (LL) additive hazard model and right plot shows results for the Lin-Ying (LY) model
Fig. 4
Fig. 4
Estimated survival probabilities from the parametric additive hazard model using different distributions compared to the Kaplan-Meier curves
Fig. 5
Fig. 5
Relative survival probabilities from the parametric additive hazard model using different distributions. The gray shaded area depicts estimated confidence intervals

References

    1. Aalen OO. A linear regression model for the analysis of life times. Stat Med. 1989;8(8):907–925. doi: 10.1002/sim.4780080803. - DOI - PubMed
    1. Aalen OO, Cook RJ, Røysland K. Does Cox analysis of a randomized survival study yield a causal treatment effect? Lifetime Data Anal. 2015;21(4):579–593. doi: 10.1007/s10985-015-9335-y. - DOI - PubMed
    1. Bollmann A, Blankenburg T, Haerting J, Kuss O, Schütte W, Dunst J, et al. Survival of patients in clinical stages I-IIIb of non-small-cell lung cancer treated with radiation therapy alone. Strahlenther Onkol. 2004;180(8):488–496. doi: 10.1007/s00066-004-1184-7. - DOI - PubMed
    1. Bradburn MJ, Clark TG, Love SB, Altman DG. Survival analysis part II: multivariate data analysis-an introduction to concepts and methods. Br J Cancer. 2003;89(3):431–436. doi: 10.1038/sj.bjc.6601119. - DOI - PMC - PubMed
    1. Brinks R, Landwehr S, Fischer-Betz R, Schneider M, Giani G. Lexis diagram and illness-death model: simulating populations in chronic disease epidemiology. PLoS ONE. 2014;9(9):e106043. doi: 10.1371/journal.pone.0106043. - DOI - PMC - PubMed