

Mapping of Family Reported Outcome Measure (FROM-16) scores to EQ-5D: algorithm to calculate utility values
- PMID: 38402530
- PMCID: PMC10973087
- DOI: 10.1007/s11136-023-03590-z
Mapping of Family Reported Outcome Measure (FROM-16) scores to EQ-5D: algorithm to calculate utility values
Abstract
Objective: Although decision scientists and health economists encourage inclusion of family member/informal carer utility in health economic evaluation, there is a lack of suitable utility measures comparable to patient utility measures such those based on the EQ-5D. This study aims to predict EQ-5D-3L utility values from Family Reported Outcome Measure (FROM-16) scores, to allow the use of FROM-16 data in health economic evaluation when EQ-5D data is not available.
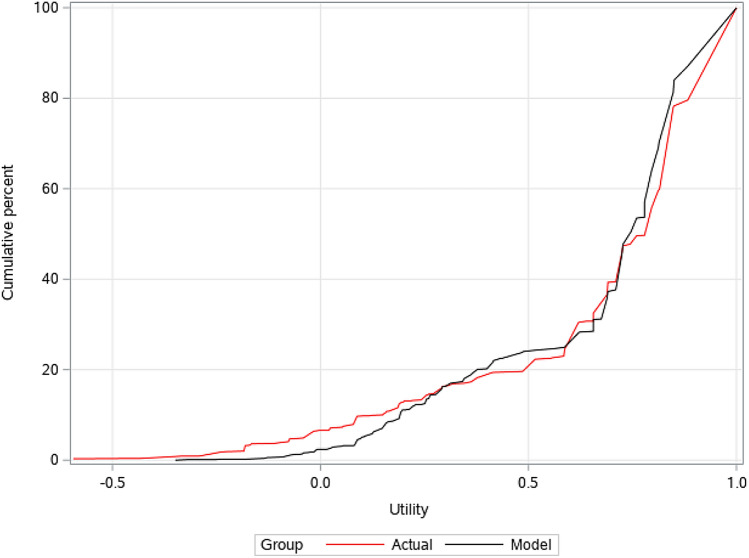
Methods: Data from 4228 family members/partners of patients recruited to an online cross-sectional study through 58 UK-based patient support groups, three research support platforms and Welsh social services departments were randomly divided five times into two groups, to derive and test a mapping model. Split-half cross-validation was employed, resulting in a total of ten multinomial logistic regression models. The Monte Carlo simulation procedure was used to generate predicted EQ-5D-3L responses, and utility scores were calculated and compared against observed values. Mean error and mean absolute error were calculated for all ten validation models. The final model algorithm was derived using the entire sample.
Results: The model was highly predictive, and its repeated fitting using multinomial logistic regression demonstrated a stable model. The mean differences between predicted and observed health utility estimates ranged from 0.005 to 0.029 across the ten modelling exercises, with an average overall difference of 0.015 (a 2.2% overestimate, not of clinical importance).
Conclusions: The algorithm developed will enable researchers and decision scientists to calculate EQ-5D health utility estimates from FROM-16 scores, thus allowing the inclusion of the family impact of disease in health economic evaluation of medical interventions when EQ-5D data is not available.
Keywords: EQ-5D; FROM-16; Family member/partner; Health economic evaluation; Health technology; Informal carer; Quality of life; Response mapping; Utility values.
© 2024. The Author(s).
Conflict of interest statement
RS, KO, RK and SJN declared no competing interest; FMA is employed by Cardiff University: Cardiff University receives royalties from some uses of FROM-16; AYF reports personal fees from Novartis Lecture honorarium, personal fees from Medscape Podcast honorarium, personal fees from Eli Lilly Lecture honorarium, outside the submitted work; MSS and AYF are joint copyright owner of the FROM-16 for which Cardiff University receives royalties for its commercial use, and they receive a share under standard university policy. JRI receives a stipend as Editor-in-Chief of the British Journal of Dermatology and an authorship honorarium from UpToDate. He is a consultant for Abbvie, Boehringer Ingelheim, ChemoCentryx, Citryll, Novartis and UCB Pharma and has served on advisory boards for Insmed, Kymera Therapeutics and Viela Bio. He is co-copyright holder of HiSQOL, Investigator Global Assessment and Patient Global Assessment instruments for HS. His department receives income from royalties for the use of the Dermatology Life Quality Index (DLQI), Family Reported Outcome Measure (FROM-16) and related instruments.
Figures


Similar articles
-
Mapping of the DLQI scores to EQ-5D utility values using ordinal logistic regression.Qual Life Res. 2017 Nov;26(11):3025-3034. doi: 10.1007/s11136-017-1607-4. Epub 2017 Jun 10. Qual Life Res. 2017. PMID: 28601958 Free PMC article.
-
Generating EQ-5D-3L Utility Scores from the Dermatology Life Quality Index: A Mapping Study in Patients with Psoriasis.Value Health. 2018 Aug;21(8):1010-1018. doi: 10.1016/j.jval.2017.10.024. Epub 2017 Dec 26. Value Health. 2018. PMID: 30098665
-
Obtaining EQ-5D-3L utility index from the health status scale of traditional Chinese medicine (TCM-HSS) based on a mapping study.Health Qual Life Outcomes. 2022 Dec 15;20(1):164. doi: 10.1186/s12955-022-02076-9. Health Qual Life Outcomes. 2022. PMID: 36522665 Free PMC article.
-
NICE DSU Technical Support Document 10: The Use of Mapping Methods to Estimate Health State Utility Values [Internet].London: National Institute for Health and Care Excellence (NICE); 2011 Apr. London: National Institute for Health and Care Excellence (NICE); 2011 Apr. PMID: 28481491 Free Books & Documents. Review.
-
A scoping review of the use of minimally important difference of EQ-5D utility index and EQ-VAS scores in health technology assessment.Health Qual Life Outcomes. 2024 Aug 13;22(1):63. doi: 10.1186/s12955-024-02272-9. Health Qual Life Outcomes. 2024. PMID: 39135171 Free PMC article.
Cited by
-
Dementia and Its Profound Impact on Family Members and Partners: A Large UK Cross-Sectional Study.Alzheimer Dis Assoc Disord. 2024 Oct-Dec 01;38(4):338-343. doi: 10.1097/WAD.0000000000000647. Epub 2024 Nov 7. Alzheimer Dis Assoc Disord. 2024. PMID: 39506214 Free PMC article.
-
Responsiveness and minimal important change of the Family Reported Outcome Measure (FROM-16).J Patient Rep Outcomes. 2024 Mar 26;8(1):38. doi: 10.1186/s41687-024-00703-1. J Patient Rep Outcomes. 2024. PMID: 38530614 Free PMC article.
-
Comparison of the impact of type 1 and type 2 diabetes on quality of life of families of patients: A UK cross-sectional study.Diabetes Obes Metab. 2025 Feb;27(2):652-662. doi: 10.1111/dom.16058. Epub 2024 Nov 24. Diabetes Obes Metab. 2025. PMID: 39582116 Free PMC article.
-
Psychometric validation of the Spanish for Ecuador Family Reported Outcome Measure (FROM-16) and its application to measure impact on family members of patients with skin diseases.J Patient Rep Outcomes. 2025 May 9;9(1):51. doi: 10.1186/s41687-025-00866-5. J Patient Rep Outcomes. 2025. PMID: 40343584 Free PMC article.
-
Multiple sclerosis greatly impacts family members/partners: Evidence using the Family Reported Outcome Measure (FROM-16).Mult Scler J Exp Transl Clin. 2025 May 27;11(2):20552173251338762. doi: 10.1177/20552173251338762. eCollection 2025 Apr-Jun. Mult Scler J Exp Transl Clin. 2025. PMID: 40444034 Free PMC article.
References
-
- Basarir H, Brockbank J, Knight C, Wolowacz S. PNS258 the inclusion of the utility values for carers and family members in HTAS: A case study of recent NICE appraisals in the UK. Value in Health. 2019;22:S330. doi: 10.1016/j.jval.2019.04.1613. - DOI
-
- (ICER), I. f. C. a. E. R. (2019). Spinraza® and Zolgensma® for spinal muscular atrophy: Effectiveness and value: Final evidence report. Retrieved September 21, 2023, from https://icer.org/wp-content/uploads/2020/10/ICER_SMA_Final_Evidence_Repo...
Publication types
MeSH terms
LinkOut - more resources
Full Text Sources
