. 2024 Mar 11;34(5):1076-1085.e5.
doi: 10.1016/j.cub.2024.01.073. Epub 2024 Feb 22.

Advanced feedback enhances sensorimotor adaptation

Affiliations

Advanced feedback enhances sensorimotor adaptation

Tianhe Wang et al. Curr Biol. .

Abstract

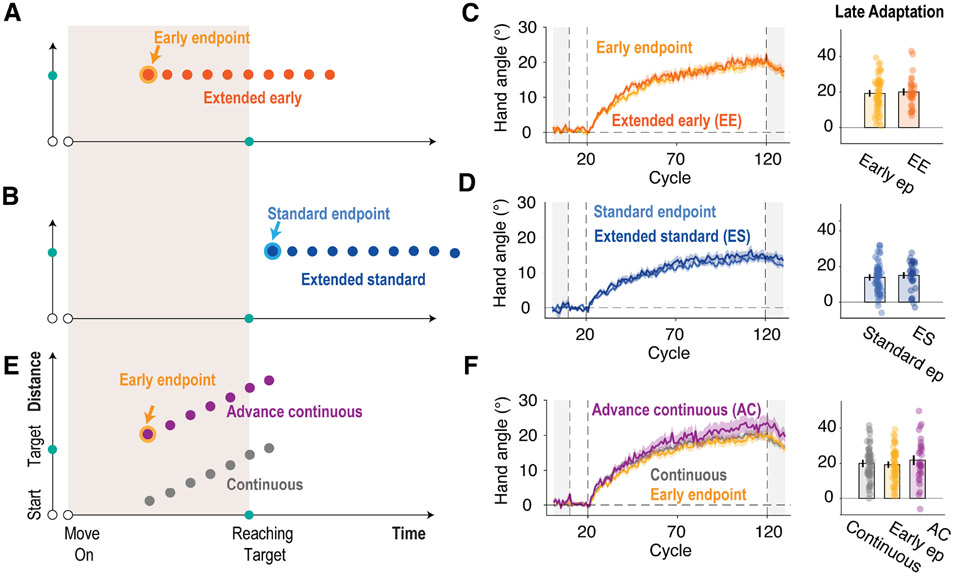
It is widely recognized that sensorimotor adaptation is facilitated when feedback is provided throughout the movement compared with when it is provided at the end of the movement. However, the source of this advantage is unclear: continuous feedback is more ecological, dynamic, and available earlier than endpoint feedback. Here, we assess the relative merits of these factors using a method that allows us to manipulate feedback timing independent of actual hand position. By manipulating the onset time of "endpoint" feedback, we found that adaptation was modulated in a non-monotonic manner, with the peak of the function occurring in advance of the hand reaching the target. Moreover, at this optimal time, learning was of similar magnitude as that observed with continuous feedback. By varying movement duration, we demonstrate that this optimal time occurs at a relatively fixed time after movement onset, an interval we hypothesize corresponds to when the comparison of the sensory prediction and feedback generates the strongest error signal.

Keywords: cerebellum; continuous feedback; endpoint feedback; feedback timing; sensorimotor adaptation.


Conflict of interest statement

Declaration of interests R.B.I is a co-founder with equity in Magnetic Tides, Inc.

Figures

Figure 1.
Figure 1.. Experimental setup, task, and feedback conditions.
A, Schematics of the web-based experimental setup (left) for Experiment 1a, 2, and 3 and the lab-based set up (right) for Experiments 1b and 4, depicting the start location (white circle), the cursor (white dot), and a target (cyan circle). B, For task-irrelevant clamped feedback, the angular position of the feedback cursor is rotated by 15° with respect to the target, regardless of the heading direction of the hand. C, Three types of clamped feedback are illustrated in task space (left) and as a function showing the position and timing of the feedback (right). As detailed in the Methods, the illustration depicts the delays associated with detecting movement onset (web-based) and presenting the visual feedback (web- and lab-based). Each dot represents one refresh cycle on the computer display monitor. Continuous feedback is presented throughout the movement, following the radial distance of the hand from the start location to the target. In the web-based system, the cursor becomes visible ~145 ms after movement initiation. At that point in time, the hand has moved ~1/3 of the distance to the target (region indicated by the dashed square). Standard endpoint feedback is presented for one refresh cycle (~25ms) after the hand reaches the target distance (corresponding to the last frame of the Continuous Feedback condition). Early endpoint feedback is presented for one refresh cycle at the radial distance of the target at ~145ms after movement initiation. The gray area indicates the interval between movement onset and when the radial distance of the movement reaches the target amplitude. For lab-based Experiment1b, we created early endpoint and standard Endpoint conditions that were temporally matched to web-based Experiment1a. See also Figure S1.
Figure 2.
Figure 2.. Implicit adaptation is enhanced by advancing endpoint feedback.
Top row: Web-based results of Experiment 1a. A, Movement time. B, Reaching angle time course for the continuous (gray), standard endpoint (blue), and early endpoint (yellow) conditions. The light gray regions indicate baseline and washout (no feedback) blocks. Black horizontal lines at the bottom indicate clusters showing significant main effect of feedback. C, Implicit adaptation magnitude, as calculated during early adaptation (cycles 21-40) and late adaptation (cycles 111-120). Bottom row: Lab-based results of Experiment 1b. D-F, Similar to panel A-C for the lab-based replication. The box plots in A and D indicate the first quartile, median, and third quartile, respectively. Shaded area in B and E and error bars in C and F indicate standard error. See also Table S1, Figure S2-3.
Figure 3.
Figure 3.. Experiment 2: The advantage in early endpoint feedback persists when the feedback position is contingent on the heading direction of the hand.
A, Illustration of trial in visuomotor rotation task with contingent endpoint feedback; the cursor is rotated by 45° with respect to the projected position of the hand based on actual hand position early in the movement. B, Similar to Experiment 1a, the average movement time was 209.8 ms; meaning, the early endpoint feedback appears 65 ms before the hand reached the target distance. C, Time courses of reaching angle. D, Magnitude of implicit adaptation calculated over the first cycle in the washout block of Experiment 2. Shaded area in C and error bars in D represent standard error. Dots in B and D represent individual participants.
Figure 4.
Figure 4.. Experiment 3: Temporal and spatial extent does not influence implicit adaptation.
A-B, Illustrations of extended versions of early and standard Endpoint feedback conditions. X-axis indicates time and Y-axis indicates radial distance of the cursor relative to the start position. Each dot represents a refresh cycle. The gray area indicates the movement period. Feedback was presented, on average, for 5 cycles in the Extended Endpoint conditions. Note that the lighter colors show the timing for the single-cycle variants of early endpoint and standard endpoint used in Experiment 1. C-D, Left: Time course of reaching angle in Experiment 3. The shaded area represents standard error. Light gray areas indicate baseline and washout blocks. No significant clusters were found in the comparison of the brief (1 cycle, data from Experiment 1a) and extended versions. Right: Comparison of reaching angle measured in late adaptation. E, In the Advanced Continuous condition, the feedback cursor appeared at the endpoint location at movement onset and then moved in the direction of the hand movement. F, As in C and D: No significant differences were observed in the cluster-based analysis of the learning functions or during late adaptation. In C-F, shaded area of the learning curve and error bars of the bar graphs represent standard error. See also Figure S4.
Figure 5.
Figure 5.. Experiment 4: The optimal timing of endpoint feedback is associated with movement onset.
A, Feedback onset for each trial was predetermined, selected from a window ranging from −200 ms to +300 ms relative to the running average of movement onset time over the last 20 trials. B-C, To vary movement duration, the distance to the target was 7 cm for one group and 15 cm for a second group. As expected, movement time increased for the long movements. D-E, Change in reaching angle (i.e., trial-by-trial motor correction) as a function of feedback onset time with respect to movement onset (top row) or when the hand reached the target distance (bottom row) for the long (D) and short movements (E). Negative values mean the feedback is presented before movement onset. The vertical dash lines indicate movement onset and when the hand reached the target distance (ReachTG). Each data point is a bin of 40 ms and the darkness of the bars indicates the relative number of samples in that bin. The colored curves are the best-fitted skewed Gaussian functions, with the colored vertical line marking the peak of each function. F, Optimal feedback time relative to movement onset (top) or when the hand reached the target distance (bottom), estimated by bootstrapping (see Methods). The optimal times for the Short and Long conditions are statistically indistinguishable when the functions are defined with respect to movement onset, but not when defined with respect to when the hand reached the target distance. Error bar represents 95% confidence interval. See also Figure S5-6.

References

    1. Wolpert DM, and Flanagan JR (2001). Motor prediction. Curr. Biol 11, R729–32. - PubMed
    1. Krakauer JW, Hadjiosif AM, Xu J, Wong AL, and Haith AM (2019). Motor Learning. Compr. Physiol 9, 613–663. - PubMed
    1. Kim HE, Avraham G, and Ivry RB (2021). The Psychology of Reaching: Action Selection, Movement Implementation, and Sensorimotor Learning. Annu. Rev. Psychol 72, 61–95. - PMC - PubMed
    1. Schween R, Taube W, Gollhofer A, and Leukel C (2014). Online and post-trial feedback differentially affect implicit adaptation to a visuomotor rotation. Exp. Brain Res 232, 3007–3013. - PubMed
    1. Hinder MR, Tresilian JR, Riek S, and Carson RG (2008). The contribution of visual feedback to visuomotor adaptation: how much and when? Brain Res. 1197, 123–134. - PubMed

Publication types