. 2024 Mar 11;34(5):1059-1075.e5.
doi: 10.1016/j.cub.2024.01.071. Epub 2024 Feb 22.

Organization of an ascending circuit that conveys flight motor state in Drosophila

Affiliations

Organization of an ascending circuit that conveys flight motor state in Drosophila

Han S J Cheong et al. Curr Biol. .

Abstract

Natural behaviors are a coordinated symphony of motor acts that drive reafferent (self-induced) sensory activation. Individual sensors cannot disambiguate exafferent (externally induced) from reafferent sources. Nevertheless, animals readily differentiate between these sources of sensory signals to carry out adaptive behaviors through corollary discharge circuits (CDCs), which provide predictive motor signals from motor pathways to sensory processing and other motor pathways. Yet, how CDCs comprehensively integrate into the nervous system remains unexplored. Here, we use connectomics, neuroanatomical, physiological, and behavioral approaches to resolve the network architecture of two pairs of ascending histaminergic neurons (AHNs) in Drosophila, which function as a predictive CDC in other insects. Both AHN pairs receive input primarily from a partially overlapping population of descending neurons, especially from DNg02, which controls wing motor output. Using Ca2+ imaging and behavioral recordings, we show that AHN activation is correlated to flight behavior and precedes wing motion. Optogenetic activation of DNg02 is sufficient to activate AHNs, indicating that AHNs are activated by descending commands in advance of behavior and not as a consequence of sensory input. Downstream, each AHN pair targets predominantly non-overlapping networks, including those that process visual, auditory, and mechanosensory information, as well as networks controlling wing, haltere, and leg sensorimotor control. These results support the conclusion that the AHNs provide a predictive motor signal about wing motor state to mostly non-overlapping sensory and motor networks. Future work will determine how AHN signaling is driven by other descending neurons and interpreted by AHN downstream targets to maintain adaptive sensorimotor performance.

Keywords: ascending neuron; connectomics; corollary discharge circuit; efference copy; ventral nerve cord.


Conflict of interest statement

Declaration of interests The authors declare no competing interests.

Figures

Figure 1.
Figure 1.. General AHN morphology and histamine expression in the CNS.
A) Histamine immunolabeling in the intact CNS of Drosophila melanogaster. ProNm; prothoracic neuromere, MsNm; Mesothoracic neuromere, MtNm; Metathoracic neuromere, ANm; Abdominal neuromere. B) Histamine immunolabeling in R48H10-Gal4 flies driving expression of diptheria toxin-A in B) the VNC as well as B’) anterior and B”) posterior depths in the brain. C) Single MsAHN clone within the C) VNC and at C’) medium and C”) posterior depths of the brain. D) Single MtAHN clone within the D) VNC and at D’) anterior depths of the brain. E, F) Manual reconstruction of a E) MsAHN and F) MtAHN within the Female Adult Fly Brain (FAFB) EM volume. Gnathal ganglia (GNG; yellow), saddle (green), antennal mechanosensory motor center (AMMC; blue), inferior posterior slope (IPS; magenta), superior posterior slope (SPS; orange). G) Reconstruction of a MtAHN (lavender) and MsAHN (green) in the FAFB (FlyWire) and Female Adult Nerve Cord EM volumes. Scale bars = 20μm. H) Cartoon schematics of the MtAHN (lavender) and MsAHN (green). See also Figure S1 and Table S1.
Figure 2.
Figure 2.. Distribution of AHN input and output regions.
A-D) Input and output regions of the MsAHNs. R17F12 ∩ VT049652 splitGal4 driving expression of the axon terminal marker synaptotagmin-eGFP (“syteGFP”; cyan) and the dendrite/soma marker ICAM5-mCherry (“DenMark”; yellow). NCAD serves as a neuropil marker (magenta). A) Horizontal view of MsAHN syteGFP and DenMark expression within the VNC. Dashed line indicates the border of the sagittal view in B. B) Sagittal view of image stack in A). C) Frontal view of MsAHN syteGFP and DenMark expression within the saddle. D) Frontal view of MsAHN syteGFP and DenMark expression within the posterior slope. E) Reconstruction of the MsAHN from the FANC EM volume with presynaptic (cyan) and postsynaptic (yellow) marked. F-I) Input and output regions of the MtAHNs. R84G04-Gal4 driving expression of the axon terminal marker synaptotagmin-eGFP (“syteGFP”; cyan) and the dendrite/soma marker ICAM5-mCherry (“DenMark”; yellow). NCAD serves as a neuropil marker (magenta). F) Horizontal view of MtAHN syteGFP and DenMark expression within the VNC. Dashed line indicates the border of the sagittal view in G. G) Sagittal view of image stack in F). H) Frontal view of MtAHN syteGFP and DenMark expression within the AMMC. I) Frontal view of MtAHN syteGFP and DenMark expression within the GNG. J) Reconstruction of the MtAHN from the FANC EM volume with presynaptic (cyan) and postsynaptic (yellow) marked. Scale bars = 20μm. See also Table S1.
Figure 3.
Figure 3.. Connectivity of upstream inputs to the AHNs.
A-B) Input synapse fractions to AHNs expressed as percent among identified upstream partners by neuron class in A) FANC and B) MANC. C-D) Graph plot of upstream partners to the AHNs in the C) FANC and D) MANC dataset. Number on node label indicates number of neurons. Edge number indicates total number of synapses. Pie chart within nodes indicates fraction of synaptic input to AHNs by neuron class. As total upstream synapse count differed between FANC and MANC, the sum of total upstream synapses to AHNs in FANC vs MANC was used to define a ‘proportionally equivalent’ synapse threshold of 3 for FANC and 10 for MANC to threshold individual neuron connectivity in A-D. E-H) Horizontal views of the postsynaptic site distributions for one MsAHN (left) and one MtAHN (right) in FANC from E) descending neurons (cyan), F) ascending neurons (lavender), G) interneurons (red), and H) sensory neurons (pink). Abbreviations: ascending neuron (AN), ascending sensory neuron (SA), descending neuron (DN), interneuron (IN), motor neuron (MN), MsAHN (MsN), MtAHN (MtN), sensory neuron (SN). See also Figure S2 and Table S1.
Figure 4.
Figure 4.. Connectivity of DNs upstream of the AHNs.
A-B) Reconstruction of DNs representing 5% or more of synaptic input from DNs to the A) MsAHNs and B) MtAHNs in both the FANC and MANC EM datasets. C-D) Input synapse fractions of DNs upstream to the MsAHNs and MtAHNs in the C) FANC and D) MANC EM datasets. DNs are placed in their own category if the DN type has ≥5% connectivity with any AHN type, otherwise they are grouped as “DNsum”. The color scheme of DN types is matched to that of the neuron reconstructions in A and B. E-F) Graph plot of DNs upstream to the MsAHNs and MtAHNs by DN type in the E) FANC and F) MANC datasets. Node number indicates number of neurons within a DN type. Edge number indicates total number of synaptic connections. Only connectivity from DNs to the AHNs is depicted. As total upstream synapse count differed between FANC and MANC, a proportionally equivalent synapse threshold of 3 for FANC and 10 for MANC was used to threshold individual neuron connectivity in C-F. Color code: MsAHNs (light orange), MtAHNs (yellow); DN types colored as in A-D. G) Reconstruction of the DNg02s (the largest source of synaptic input to the AHNs) in the FANC EM data set. H) VT039465-p65ADZ; VT023750-ZpGdbd (SS02625) splitGal4 line expressed in DNg02s (white). Brp (nc82 antibody) used to delineate neuropil. Image courtesy of Shigehiro Namiki,. I) Intersection between the DNg02 splitGal4 (yellow) and a ChAT-T2A-LexA (cyan) driver lines reveals that the DNg02s are cholinergic. NCAD (magenta) delineates neuropil and scale bar = 20μm. J-L) Flight-induced changes in Ca2+ levels measured via epifluorescence imaging of jGCaMP7 in J) the DNg02s (6 flies, 3 trials), K) the MsAHNs (6 flies, 6 soma, 3 trials) and L) the MtAHNs (9 flies, 13 soma, 3 trials). Cartoons depict orientation of flies during each recording and green line indicates timing of flight initiation following an airpuff. Gray traces represent recordings from individual replicates from dendrites (DNg02) or soma (AHNs) and black trace represents the average Ca2+ transient across all animals. M) Ca2+ activity in the 1 s period around flight initiation in high speed Ca2+ imaging (100 Hz calcium and behavioral imaging, 9 flies, 3 trials, 12 soma; box in S3M). Green line at t = 0 s indicates flight initiation timing. Black line is the mean across all animals and replicates. N) Mean per-fly difference between Ca2+ rise timing to flight initiation for MsAHNs as determined by synchronized behavioral capture and high speed Ca2+ imaging (9 flies, 3 trials, 12 soma). Difference is significantly lower than zero by one-tailed Wilcoxon signed rank test (p = 0.023, α = 0.05). O) Ca2+ transients evoked measured via two-photon imaging of jGCaMP7 in the MtAHNs in response to CsChrimson activation of the DNg02s. Gray traces represent recordings from individual AHN soma and black trace represents the mean fluorescence transient across all animals. See also Figure S3, Videos S1 & S2, and Table S1.
Figure 5.
Figure 5.. Downstream connectivity of the AHNs in the brain.
A) Synapse fractions of downstream partners of AHNs by neuron class in the brain in the FAFB (FlyWire) dataset. B) Graph plot of the downstream targets of the AHNs in the FAFB (FlyWire) dataset by cell class. This connectivity reveals virtually no overlap in downstream targets between MsAHNs and MtAHNs, with no synapse threshold applied. Node number indicates number of neurons. Pie chart within nodes indicates fraction of output from AHNs by cell class. Edge number indicates total number of synaptic connections. Abbreviations: ascending neurons (AN; lavender), descending neurons (DN; cyan), interneurons (IN; red), motor neurons (MN; blue), sensory neurons (pink), visual centrifugal neurons (VCN; salmon), visual projection neurons (VPN; light blue). Cell class derived from ‘superclass’ annotations in FlyWire. MsAHNs colored light orange, and MtAHNs colored yellow. C) Matrices of effective connection strength (see Figure S4C) for connectivity between each AHN pair to indirect downstream neuron types at a path length of 2 in FAFB (FlyWire). Left, top 50 indirect downstream neuron types for the MsAHNs; right, top 50 for the MtAHNs. Neuron types with high effective connectivity with one AHN pair generally have no or weak effective connectivity with the other. Colored side bars indicate cell class using the same colors in A. Neuron types with per-type input <100 were excluded from the final matrix as they were typically poorly segmented. D-E) Top 5 neuron types receiving the largest synapse count per type from D) MsAHNs and E) MtAHNs in FAFB (FlyWire). Neuron types shown are LB3_2, PSp2_3, CB0214, WEDd1_1, DM1_antero_ventral_2 for MsAHNs and CB0174, WEDa1_1, JOA, DNge079, DNge230 for MtAHNs. Type names are assigned neuron types, or morphological groups if not assigned, as defined previously . Neurons of the same type are colored different shades of similar colors. F-G) Neuropil arborization of top direct downstream neuron types for F) MsAHNs and G) MtAHNs. Only neuropil categories with ≥10% input or output from each neuron type are shown. Only downstream types above an outlier threshold of synapse counts with AHNs (above the 3rd quartile plus 1.5 x interquartile range) are included. Type names are assigned neuron types (black labels), or morphological groups (magenta labels) if not assigned, as defined previously. Green labels are manually assigned neuron types in this work (further see STAR Methods, Table S2). Neuropil supercategory abbreviations: ventrolateral neuropils (VLNP), ventromedial neuropils (VMNP), inferior neuropils (INP), periesophageal neuropils (PENP), gnathal ganglia (GNG). Single neuropil abbreviations: gorget (GOR), superior posterior slope (SPS), inferior posterior slope (IPS), antennal mechanosensory and motor center (AMMC), saddle (SAD). Left and right neuropils are combined, and neuropils besides those of the VMNP and PENP are further combined into supercategories. Only neuropil categories with ≥10% input or output from each neuron type are shown. See also Figure S4, Table S2.
Figure 6.
Figure 6.. Downstream connectivity of the AHNs in the VNC, and association of MsAHNs in a wing feedforward network with DNg02.
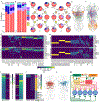
A-B) Synapse fractions of downstream partners of AHNs by neuron class in the brain in the A) FANC and B) MANC dataset. C-D) Graph plot of downstream partners of the AHNs in the C) FANC and D) MANC dataset. Node number indicates number of neurons within a neuronal category. Edge number indicates total number of synaptic connections. Pie chart within nodes indicates fraction of synaptic output from AHNs by cell class. A proportionally equivalent synapse threshold of 3 for both FANC and MANC was used to threshold individual neuron connectivity in A-D. E-F) Top 5 neuron groups receiving the largest synapse count per group from E) MsAHNs and F) MtAHNs in MANC. Neuron types shown are IN19B043 (group 14502), IN03B058 (group 21430), IN11B004 (group 25868), DVMn 1a-c, DLMn c-f for MsAHNs and AN02A001, DNxl080, IN17B003, IN21A004 (group 10978), IN04B002 for MtAHNs. G-H) Neuropil arborization of top direct downstream neuron types for G) MsAHNs and H) MtAHNs in MANC. Only downstream neuron groups above an outlier threshold of synapse counts with AHNs (above the 3rd quartile plus 1.5 x interquartile range) were included. Neuropil abbreviations: neck tectulum (NTct), wing tectulum (WTct), haltere tectulum (HTct), intermediate tectulum (IntTct), lower tectulum (LTct), prothoracic leg neuropil (LegNp T1), mesothoracic leg neuropil (LegNp T2), metathoracic leg neuropil (LegNp T3), ovoid/accessory mesothoracic neuropil (Ov), medial ventral association center (mVAC), abdominal neuromeres (ANm). Left and right neuropils are combined, and the mVACs are further combined across all thoracic segments. Only neuropil categories with ≥10% input or output from each neuron type are shown. Neuron type names are MANC annotated ‘type’, appended with morphological ‘group’ (5-6 digit number) if each type contains more than one group. Wing-tectular INs identified in panels K-M are named ‘Tect IN’ in lieu of MANC type. Number in parenthesis indicates cell count. I) Matrices of effective connection strength (see Figure S4C) for connectivity between each AHN pair to indirect downstream neuron types at a path length of 2 in FAFB (FlyWire). Left, top 50 indirect downstream neuron types for the MsAHNs; right, top 50 for the MtAHNs. Neuron types with high effective connectivity with one AHN pair generally have no or weak effective connectivity with the other. Colored side bars indicate cell class using the same colors in A. J) Matrix of effective connection strength for connectivity between each AHN pair to all MN groups in MANC at a path length of 2. MN target muscle categories: wing (pink), leg (gold), neck (green), haltere (blue) or abdominal (grey). K-L) The cell classes receiving the greatest amount of synaptic input from the MsAHNs were K) a population of wing-tectular INs (shades of red) and L) wing power MNs (shades of blue); only a subset of wing-tectular INs and one of each wing MN type are shown for clarity. M) Circuit motif depicting the relationship between the DNg02s (green), DNp54s (orange), MsAHNs (light orange), wing-tectular INs (red) and wing MNs (blue). The DNg02s and DNp54s are reciprocally connected and synapse upon the MsAHNs. The DNg02s and MsAHNs further synapse upon the wing-tectular INs and wing MNs (MNs of the dorsal longitudinal muscles; DLMn a, b and DLMn c-f, and of the dorsal ventral muscles; DVMn 1a-c, DVMn 2a, b and DVMn 3a, b). See also Figure S5.

Update of

Similar articles

Cited by

  • A Closer Look at Histamine in Drosophila.
    Volonté C, Liguori F, Amadio S. Volonté C, et al. Int J Mol Sci. 2024 Apr 18;25(8):4449. doi: 10.3390/ijms25084449. Int J Mol Sci. 2024. PMID: 38674034 Free PMC article. Review.
  • Insect Flight: State of the Field and Future Directions.
    Treidel LA, Deem KD, Salcedo MK, Dickinson MH, Bruce HS, Darveau CA, Dickerson BH, Ellers O, Glass JR, Gordon CM, Harrison JF, Hedrick TL, Johnson MG, Lebenzon JE, Marden JH, Niitepõld K, Sane SP, Sponberg S, Talal S, Williams CM, Wold ES. Treidel LA, et al. Integr Comp Biol. 2024 Jul 9;64(2):533-55. doi: 10.1093/icb/icae106. Online ahead of print. Integr Comp Biol. 2024. PMID: 38982327 Free PMC article.
  • Distributed control circuits across a brain-and-cord connectome.
    Bates AS, Phelps JS, Kim M, Yang HH, Matsliah A, Ajabi Z, Perlman E, Delgado KM, Osman MAM, Salmon CK, Gager J, Silverman B, Renauld S, Collie MF, Fan J, Pacheco DA, Zhao Y, Patel J, Zhang W, Serratosa Capdevilla L, Roberts RJV, Munnelly EJ, Griggs N, Langley H, Moya-Llamas B, Maloney RT, Yu SC, Sterling AR, Sorek M, Kruk K, Serafetinidis N, Dhawan S, Stürner T, Klemm F, Brooks P, Lesser E, Jones JM, Pierce-Lundgren SE, Lee SY, Luo Y, Cook AP, McKim TH, Kophs EC, Falt T, Negrón Morales AM, Burke A, Hebditch J, Willie KP, Willie R, Popovych S, Kemnitz N, Ih D, Lee K, Lu R, Halageri A, Bae JA, Jourdan B, Schwartzman G, Demarest DD, Behnke E, Bland D, Kristiansen A, Skelton J, Stocks T, Garner D, Salman F, Daly KC, Hernandez A, Kumar S; BANC-FlyWire Consortium; Dorkenwald S, Collman F, Suver MP, Fenk LM, Pankratz MJ, Jefferis GSXE, Eichler K, Seeds AM, Hampel S, Agrawal S, Zandawala M, Macrina T, Adjavon DY, Funke J, Tuthill JC, Azevedo A, Seung HS, de Bivort BL, Murthy M, Drugowitsch J, Wilson RI, Lee WA. Bates AS, et al. bioRxiv [Preprint]. 2025 Aug 2:2025.07.31.667571. doi: 10.1101/2025.07.31.667571. bioRxiv. 2025. PMID: 40766407 Free PMC article. Preprint.
  • Regulation of diel locomotor activity and retinal responses of Anopheles stephensi by ingested histamine and serotonin is temperature- and infection-dependent.
    Ochwedo KO, Wang X, Céspedes N, Bentil RE, Wild R, Hernandez E, Hernandez A, Kaylor HL, Debebe Y, Datta J, Robert MA, Riffell JA, Lewis EE, Luckhart S. Ochwedo KO, et al. PLoS Pathog. 2025 Apr 28;21(4):e1013139. doi: 10.1371/journal.ppat.1013139. eCollection 2025 Apr. PLoS Pathog. 2025. PMID: 40294029 Free PMC article.
  • Comparative connectomics of the descending and ascending neurons of the Drosophila nervous system: stereotypy and sexual dimorphism.
    Stürner T, Brooks P, Capdevila LS, Morris BJ, Javier A, Fang S, Gkantia M, Cachero S, Beckett IR, Champion AS, Moitra I, Richards A, Klemm F, Kugel L, Namiki S, Cheong HSJ, Kovalyak J, Tenshaw E, Parekh R, Schlegel P, Phelps JS, Mark B, Dorkenwald S, Bates AS, Matsliah A, Yu SC, McKellar CE, Sterling A, Seung S, Murthy M, Tuthill J, Lee WA, Card GM, Costa M, Jefferis GSXE, Eichler K. Stürner T, et al. bioRxiv [Preprint]. 2024 Jun 28:2024.06.04.596633. doi: 10.1101/2024.06.04.596633. bioRxiv. 2024. PMID: 38895426 Free PMC article. Preprint.

References

    1. von Holst E, and Mittelstaedt H (1950). Das Reafferenzprinzip. Naturwissenschaften 37, 464–476. 10.1007/BF00622503. - DOI
    1. Straka H, Simmers J, and Chagnaud BP (2018). A new perspective on predictive motor signaling. Curr. Biol 28, R232–R243. 10.1016/j.cub.2018.01.033. - DOI - PubMed
    1. Fee MS, Mitra PP, and Kleinfeld D (1997). Central versus peripheral determinants of patterned spike activity in rat vibrissa cortex during whisking. J. Neurophysiol 78, 1144–1149. 10.1152/jn.1997.78.2.1144. - DOI - PubMed
    1. Chapman PD, Burkland R, Bradley SP, Houot B, Bullman V, Dacks AM, and Daly KC (2018). Flight motor networks modulate primary olfactory processing in the moth Manduca sexta. Proc Natl Acad Sci USA 115, 5588–5593. 10.1073/pnas.1722379115. - DOI - PMC - PubMed
    1. Chagnaud BP, and Bass AH (2013). Vocal corollary discharge communicates call duration to vertebrate auditory system. J. Neurosci 33, 18775–18780. 10.1523/JNEUROSCI.3140-13.2013. - DOI - PMC - PubMed

LinkOut - more resources