. 2024 Apr 15;382(2270):20230141.
doi: 10.1098/rsta.2023.0141. Epub 2024 Feb 26.

Legal hypergraphs

Affiliations

Legal hypergraphs

Corinna Coupette et al. Philos Trans A Math Phys Eng Sci. .

Abstract

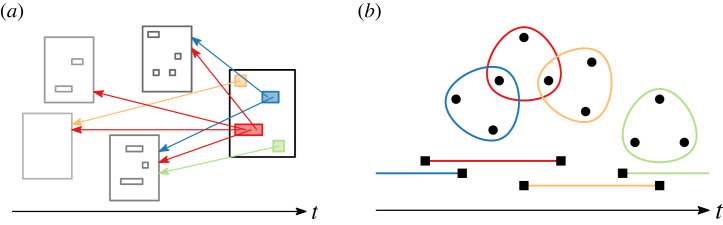
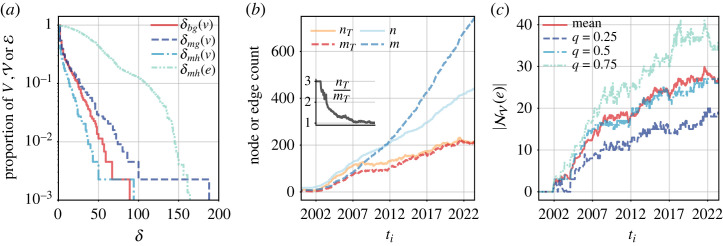
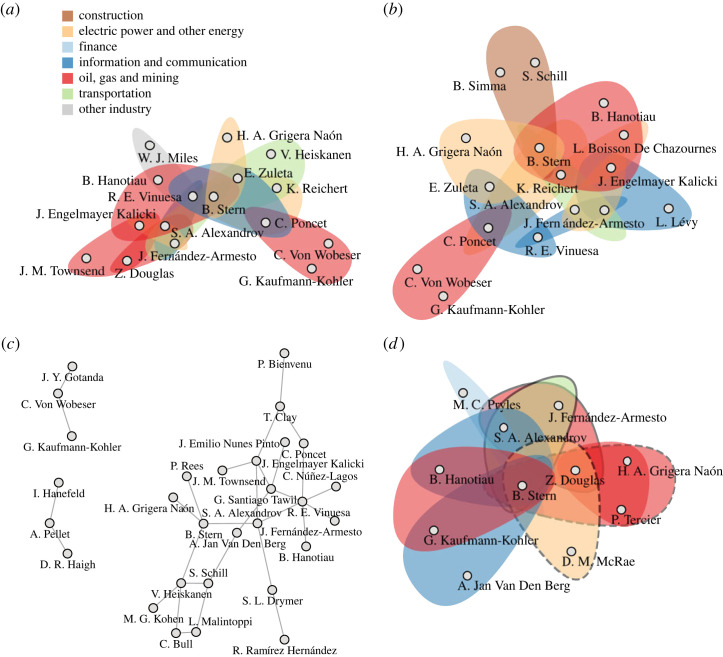
Complexity science provides a powerful framework for understanding physical, biological and social systems, and network analysis is one of its principal tools. Since many complex systems exhibit multilateral interactions that change over time, in recent years, network scientists have become increasingly interested in modelling and measuring dynamic networks featuring higher-order relations. At the same time, while network analysis has been more widely adopted to investigate the structure and evolution of law as a complex system, the utility of dynamic higher-order networks in the legal domain has remained largely unexplored. Setting out to change this, we introduce temporal hypergraphs as a powerful tool for studying legal network data. Temporal hypergraphs generalize static graphs by (i) allowing any number of nodes to participate in an edge and (ii) permitting nodes or edges to be added, modified or deleted. We describe models and methods to explore legal hypergraphs that evolve over time and elucidate their benefits through case studies on legal citation and collaboration networks that change over a period of more than 70 years. Our work demonstrates the potential of dynamic higher-order networks for studying complex legal systems, and it facilitates further advances in legal network analysis. This article is part of the theme issue 'A complexity science approach to law and governance'.

Keywords: complex systems; higher-order networks; hypergraphs; legal complexity; legal networks; temporal networks.


Conflict of interest statement

We declare we have no competing interests.

Figures

Figure 1.
Figure 1.
Schematic depiction of the phenomena captured by our datasets. With GFCC, we seek to understand the development of constitutional jurisprudence, with a particular view to how new decisions (large rectangles) create meaning by combining ideas from previous decisions (arrows, drawn here only for the most recent decision, and small rectangles). With ICSID, we would like to explore how the social structure of an elite group, arbitrators (circles) appointed to panels in international-arbitration cases (lines and rounded polygons), evolves over time. (a) GFCC, (b) ICSID. (Online version in colour.)
Figure 2.
Figure 2.
Routes from static graphs to temporal hypergraphs. We will go via temporal graphs when modelling the GFCC data, and via static hypergraphs when modelling the ICSID data.
Figure 3.
Figure 3.
Three prominent decisions from the GFCC corpus depicted as hypergraphs (labeled {volume}, {page}). The decisions concern data privacy (a), European integration (b) and religious freedom (c), respectively. In each panel, nodes represent decisions cited at least once by the visualized decision, and (hyper)edges indicate unique citation blocks. Hyperedge colours progress, by increasing cardinality, from light yellow to dark blue and then red, with binary edges (indicating that exactly two decisions share a citation block) drawn in black. To limit visual clutter, we encode neither the sequential order of hyperedges nor their multiplicities. (a) 125, 260—Retention of Data, (b) 135, 317—ESM Treaty, (c) 153, 1—Headscarf III. (Online version in colour.)
Figure 4.
Figure 4.
Descriptive statistics based on different network models of the GFCC data. We show (i) the evolution of n and m in the temporal graph and hypergraph models, (ii) empirical CCDFs of edge sizes at different time points in the temporal multi-hypergraph model (b), and (iii) empirical CCDFs of thresholded edge-neighbourhood sizes for the last hypergraph in the temporal hypergraph model with binary edges (b) or multi-edges (m) (c). (a) Evolution of GT and HT, (b) edge sizes in Ξt, (c) neighbourhood sizes in ΞT. (Online version in colour.)
Figure 5.
Figure 5.
Descriptive statistics based on different network models of the ICSID data. We show (i) the empirical CCDFs of degrees for the static graph G and the static hypergraph H (a), (ii) the evolution of n and m in HT in contrast to a static H cut off at the same time stamp (b), and (iii) statistics characterizing how the distribution of the number of nodes (arbitrators) in the neighbourhood of an edge (case) in HT changes over time (c). (a) Degrees in G and H, (b) order and size in HT and H, (c) neighbourhood sizes in HT. (Online version in colour.)
Figure 6.
Figure 6.
Centrality backbone of the ICSID data as assessed by different centrality measures. Hyperedges represent ICSID cases and nodes represent arbitrators participating in their tribunals. We show the top-ranked hyperedges based on the last snapshot of the temporal hypergraph representation, ΞT, using either hyperedge 1-betweenness centrality ((a), hyperedges ranked 10) or hyperedge 1-closeness centrality ((b), hyperedges ranked 10), the top-ranked edges (indicating that two arbitrators shared a tribunal) based on the last snapshot of the temporal graph representation, ΓT, as judged by edge betweenness centrality ((c), edges ranked 30), and the top-ranked hyperedges based on the static hypergraph representation, H, as judged by hyperedge 1-closeness centrality ((d), hyperedges ranked 7). In (a,b,d), cases are coloured by their economic sector. In figure 6d, we additionally surround cases concluded before 2017 with dashed black lines and cases whose tribunal was constituted after 2017 with solid black lines, thus highlighting that not all top-ranked cases in H had overlapping activity times. (a) Hyperedge 1-betweenness centrality on ΞT. (b) Hyperedge 1-closeness centrality on ΞT. (c) Edge betweenness centrality on ΓT. (d) Hyperedge 1-closeness centrality on H. (Online version in colour.)
Figure 7.
Figure 7.
Theoretically possible 4-motifs in 3-uniform hypergraphs (a), and frequency of the Y-motif in a population of 1000 hypergraphs drawn from the configuration model, with the same node-degree distribution and edge-cardinality distribution as our ICSID hypergraph (red line), for the last hypergraph snapshot in our temporal hypergraph ΞT (b) and the statically modelled hypergraph H (c), with annotated counts cm(Y) and z-scores z. In the ICSID data, the Y-motif occurs much more frequently than expected under the null model. (a) Feasible 4-motifs. (b) Y-motif in ΞT. (c) Y-motif in H. (Online version in colour.)
Figure 8.
Figure 8.
In the association-graph construction, we transform (1) a hypergraph H with coloured hyperedges (indicating citation blocks that belong to the same decision) into (2) a weighted clique expansion of H, optionally (3) augmenting this expansion with star-expansion-like self-affiliations (a). Infomap clusterings are more balanced when based on an association-graph representation derived from the GFCC hypergraph than when based on one of the traditional directed graph representations, as indicated by the cluster-size distribution of the AMI-determined medoids of 50 differently seeded clusterings using the same model (b). Clusterings based on association graphs also capture node-to-node relationships differently, as indicated by the AMI and ARI scores of pairwise comparisons between the medoid clusterings of each model (c). In figures (b,c), labels encode the underlying (hyper)graph representation as (binarymulti)(graphhypergraph)[self-association (versus none)undirected flow (versus directed)]. (a) Association-graph construction, (b) medoid cluster-size distribution. (c) medoid clustering similarity. (Online version in colour.)

References

    1. Ruhl J, Katz DM, Bommarito MJ. 2017. Harnessing legal complexity. Science 355, 1377-1378. (10.1126/science.aag3013) - DOI - PubMed
    1. Murray J, Webb T, Wheatley S. 2018. Complexity theory and law: mapping an emergent jurisprudence. Oxfordshire: Routledge.
    1. Ruhl J, Katz DM. 2015. Measuring, monitoring, and managing legal complexity. Iowa Law Rev. 101, 191-244.
    1. Ruhl JB. 2007. Law’s complexity: a primer. Ga. St. UL Rev. 24, 885-911. (10.58948/0738-6206.1052) - DOI
    1. Thurner S, Hanel R, Klimek P. 2018. Introduction to the theory of complex systems. Oxford, UK: Oxford University Press.

LinkOut - more resources