. 2024 May;11(17):e2309032.
doi: 10.1002/advs.202309032. Epub 2024 Feb 25.

Shared and Compartment-Specific Processes in Nucleus Pulposus and Annulus Fibrosus During Intervertebral Disc Degeneration

Affiliations

Shared and Compartment-Specific Processes in Nucleus Pulposus and Annulus Fibrosus During Intervertebral Disc Degeneration

Hannah Swahn et al. Adv Sci (Weinh). 2024 May.

Abstract

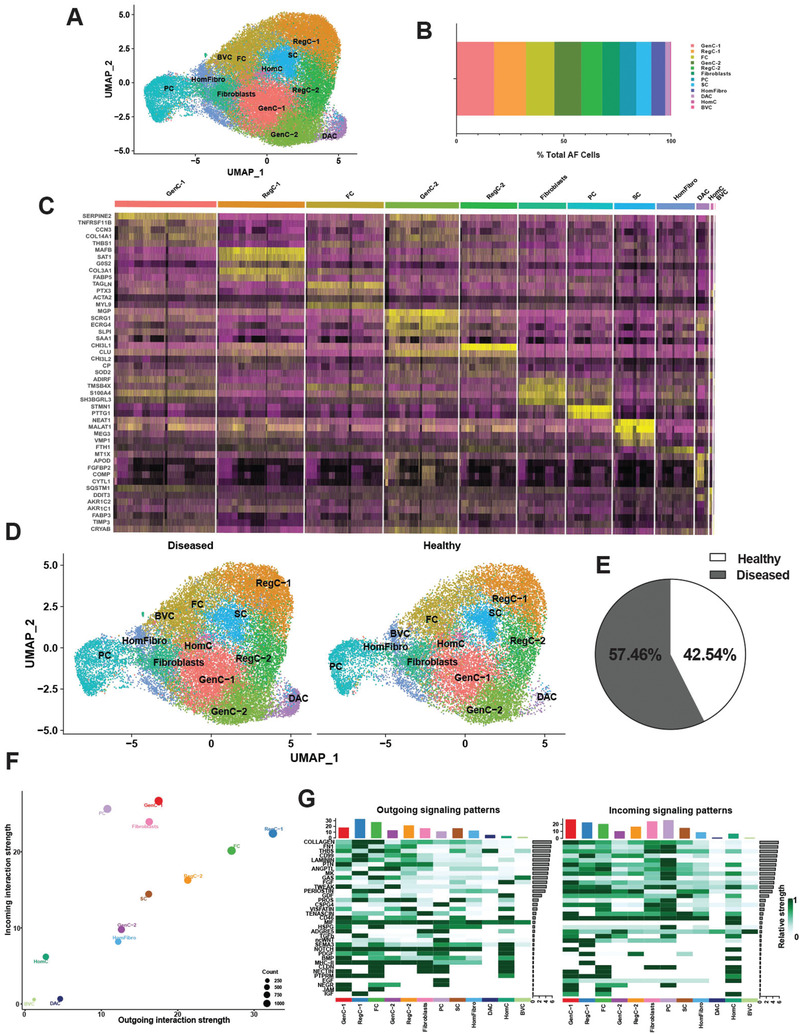
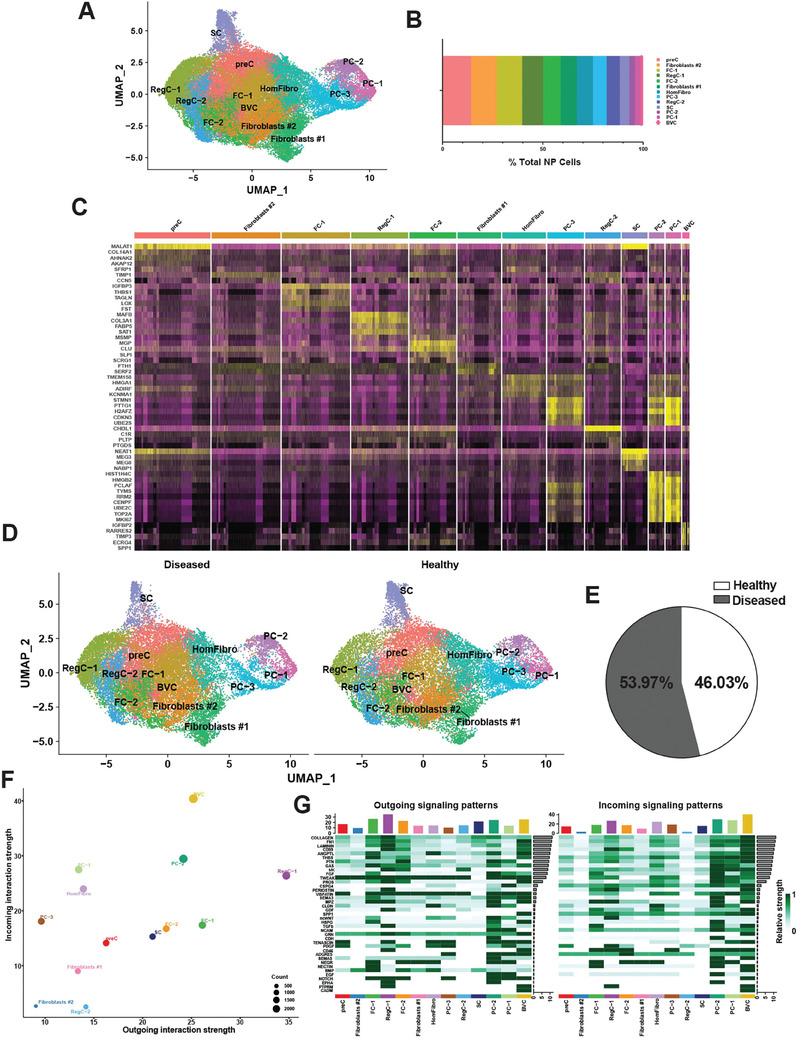
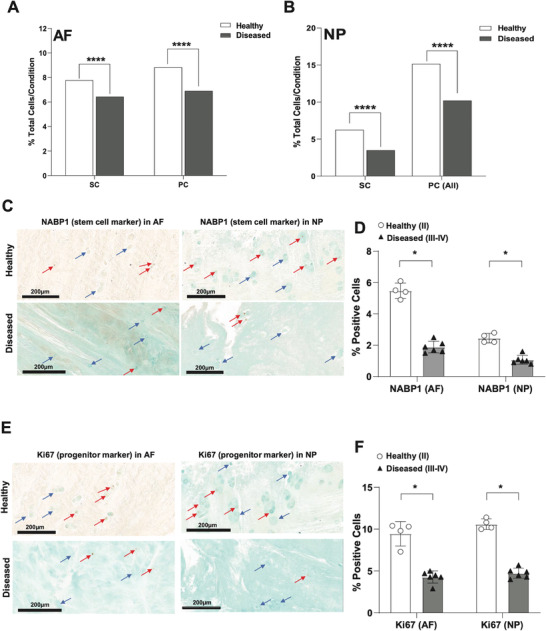
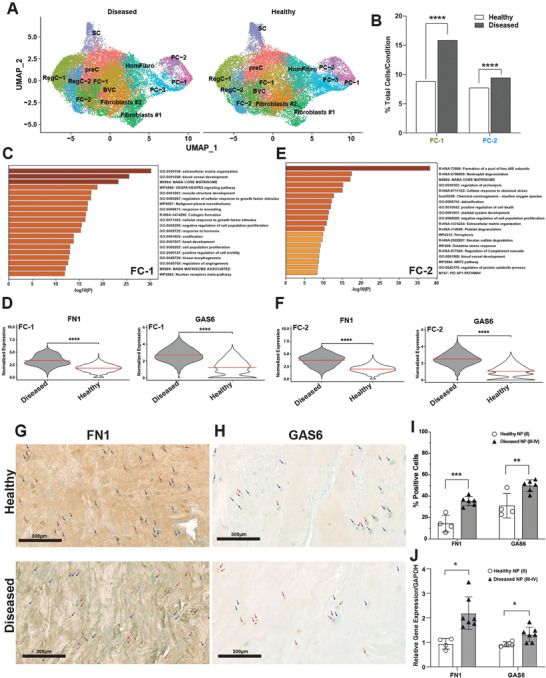
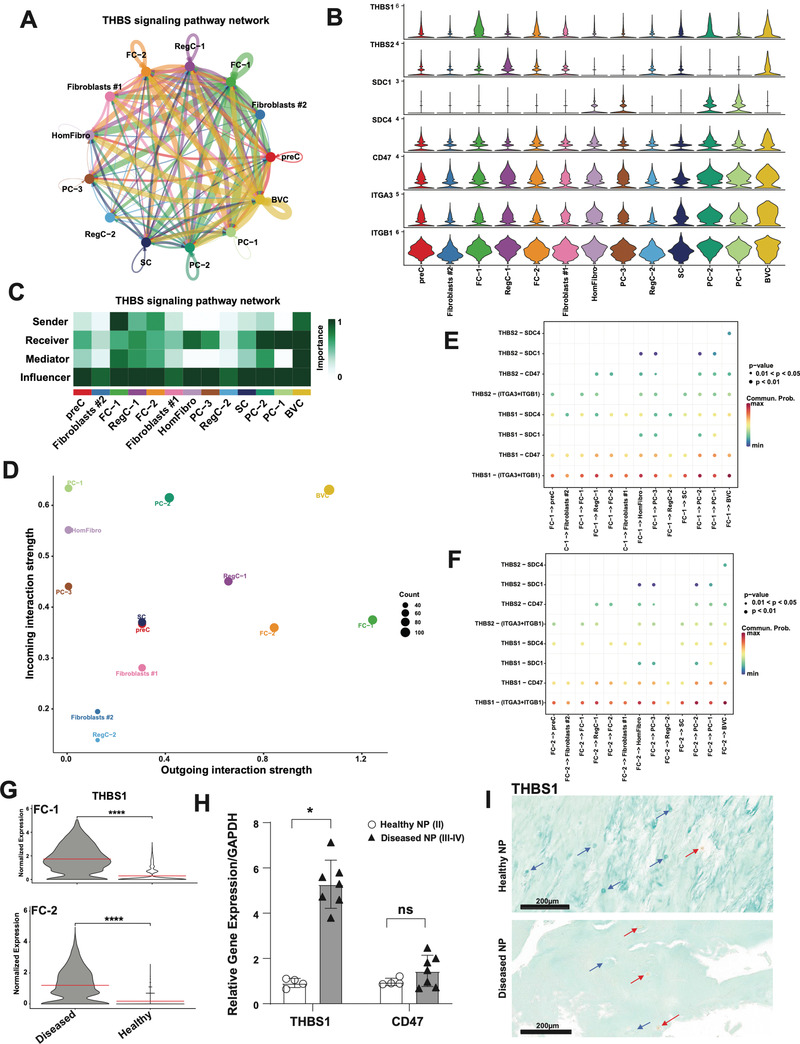
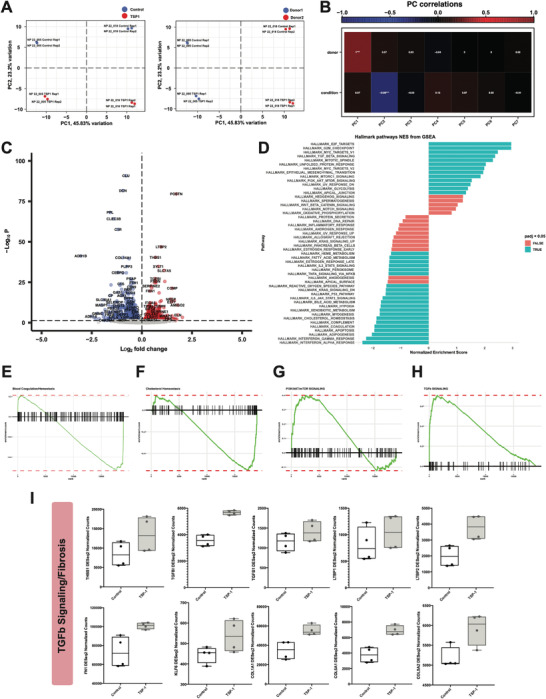
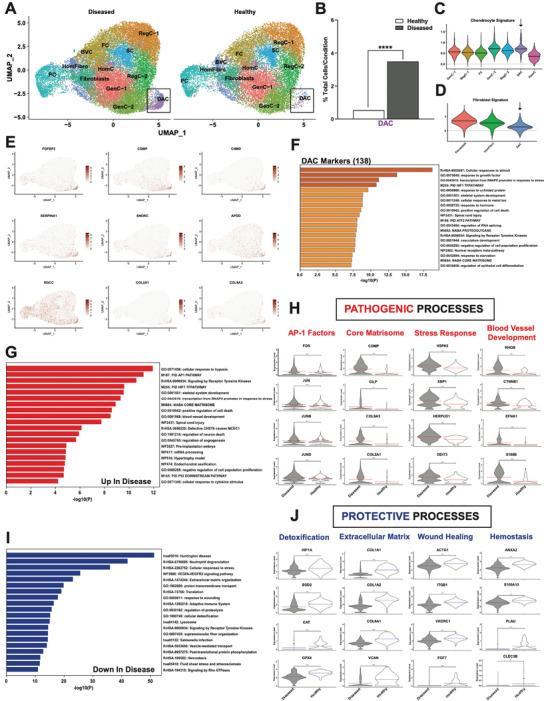
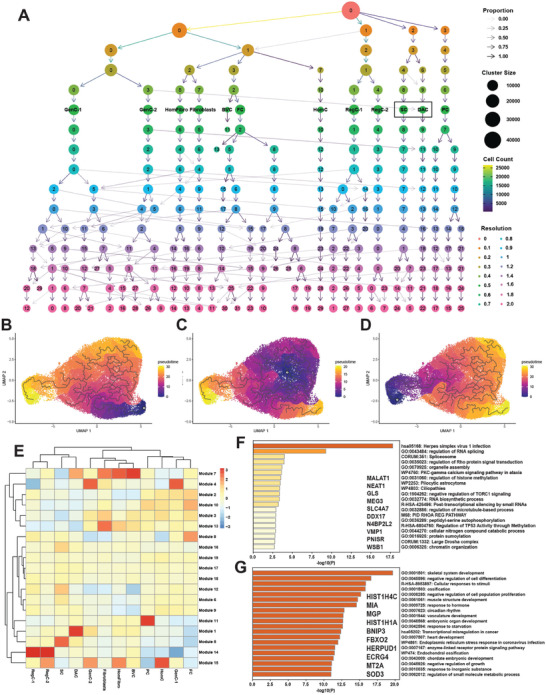
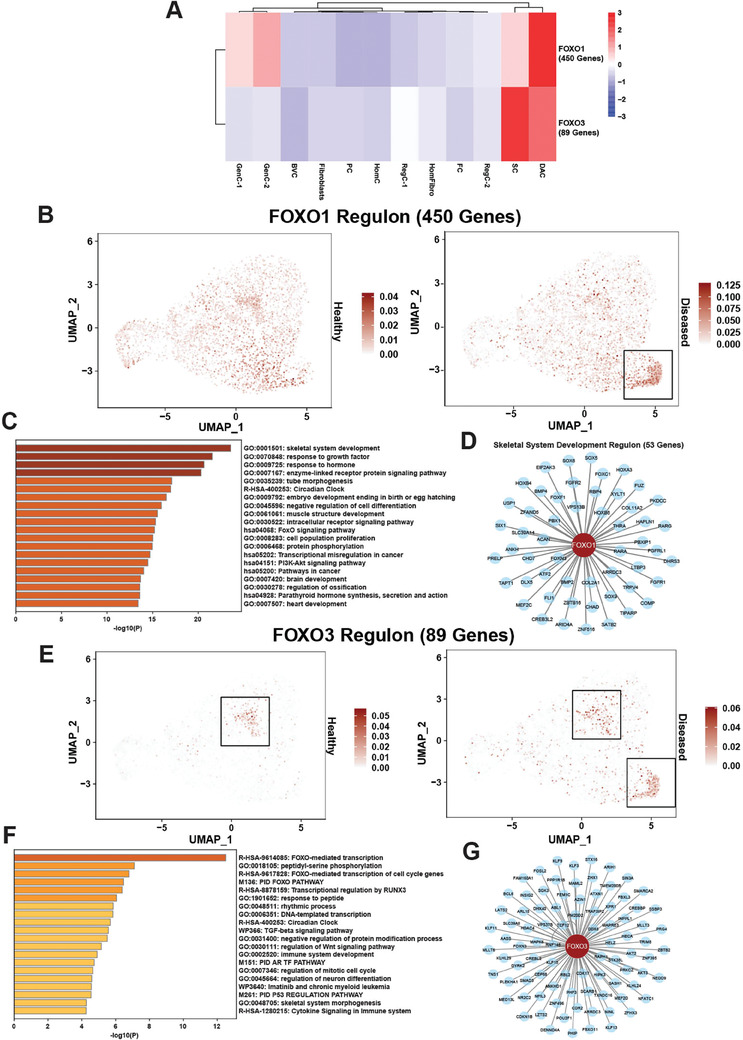
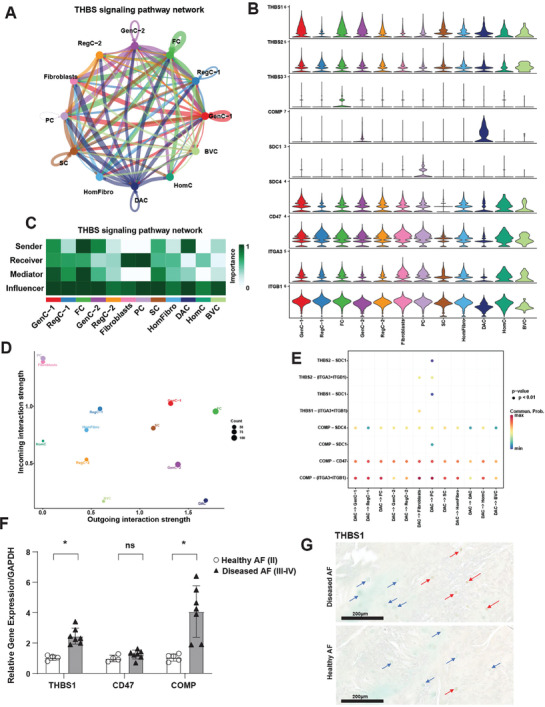
Elucidating how cell populations promote onset and progression of intervertebral disc degeneration (IDD) has the potential to enable more precise therapeutic targeting of cells and mechanisms. Single-cell RNA-sequencing (scRNA-seq) is performed on surgically separated annulus fibrosus (AF) (19,978; 26,983 cells) and nucleus pulposus (NP) (20,884; 24,489 cells) from healthy and diseased human intervertebral discs (IVD). In both tissue types, depletion of cell subsets involved in maintenance of healthy IVD is observed, specifically the immature cell subsets - fibroblast progenitors and stem cells - indicative of an impairment of normal tissue self-renewal. Tissue-specific changes are also identified. In NP, several fibrotic populations are increased in degenerated IVD, indicating tissue-remodeling. In degenerated AF, a novel disease-associated subset is identified, which expresses disease-promoting genes. It is associated with pathogenic biological processes and the main gene regulatory networks include thrombospondin signaling and FOXO1 transcription factor. In NP and AF cells thrombospondin protein promoted expression of genes associated with TGFβ/fibrosis signaling, angiogenesis, and nervous system development. The data reveal new insights of both shared and tissue-specific changes in specific cell populations in AF and NP during IVD degeneration. These identified mechanisms and molecules are novel and more precise targets for IDD prevention and treatment.

Keywords: FOXO transcription factors; intervertebral disc (IVD); intervertebral disc degeneration (IDD); single‐cell RNA‐sequencing (scRNA‐seq); thrombospondin (THBS) signaling.


Conflict of interest statement

The authors declare no conflict of interest.

Figures

Figure 1
Figure 1
Single‐cell RNA sequencing of healthy and diseased human AF. A) Visualization of clustering by UMAP plot of healthy and diseased AF samples (n = 13) using 0.5 resolution. B) Quantification of AF cluster contribution shown as percentage of total AF cell count of the integrated data set. C) Top markers for each AF cluster visualized in a heat map. D) Visualization of clustering by split UMAP plot of healthy (n = 3) versus diseased (n = 10) AF samples. E) Percentage of cells from each condition (healthy versus diseased) are shown in a pie chart. F) CellChat analysis was performed to interrogate cell‐cell communication patterns between clusters in AF. Overall outgoing and incoming signal strength of each cluster was visualized in a scatter plot. G) Relative strength of all enriched signals across AF clusters was visualized in a heat map. For all panels: GenC (general chondrocytes), RegC (regulatory chondrocytes), FC (fibrochondrocytes), HomC (homeostatic chondrocytes), HomFibro (homeostatic fibroblasts), PC (progenitor cells), SC (stem cells), BVC (blood vessel cells) and DAC (disease‐associated chondrocytes). Healthy = grade II; Diseased = grade II‐III, grade III and grade III‐IV.
Figure 2
Figure 2
Single‐cell RNA sequencing of healthy and diseased human NP. A) Visualization of clustering by UMAP plot of healthy and diseased NP samples (n = 11) using 0.5 resolution. B) Quantification of NP cluster contribution shown as percentage of total NP cell count of the integrated data set. C) Top markers for each NP cluster visualized in a heat map. D) Visualization of clustering by split UMAP plot of healthy (n = 3) versus diseased (n = 8) NP samples. E) Percentage of cells from each condition (healthy versus diseased) are shown in a pie chart. F) CellChat analysis was performed to interrogate cell‐cell communication patterns between clusters in NP. Overall outgoing and incoming signal strength of each cluster was visualized in a scatter plot. G) Relative strength of all enriched signals across NP clusters was visualized in a heat map. For all panels: GenC (general chondrocytes), RegC (regulatory chondrocytes), FC (fibrochondrocytes), HomC (homeostatic chondrocytes), HomFibro (homeostatic fibroblasts), PC (progenitor cells), SC (stem cells) and BVC (blood vessel cells). Healthy = grade II; Diseased = grade II‐III, grade III and grade III‐IV.
Figure 3
Figure 3
Depletion of immature subsets in diseased AF and NP. A,B) Quantification of stem cell (SC) and progenitor cell (PC) subsets in healthy versus diseased AF (A) and NP (B). Data are shown as percentage of total cells for each condition in each tissue type. ****p<0.0001 by comparison of proportions tests. Healthy = grade II; Diseased = grade II‐III, grade III and grade III‐IV. C–F) IHC for NABP1 (C,D) and MKI67 (E,F) was performed on healthy (grade II, n = 4) and diseased (grade III‐IV, n = 6) AF and NP tissues. Counterstaining was performed using methyl green to calculate percentages of positive cells verses total cell numbers. Red arrows indicate examples for positive cells and blue arrows show negative cells. Scale bars indicate 200 µm. Quantifications of cells positive for NABP1 (D) or MKI67 (F) in healthy (n = 4) versus diseased (n = 6) AF (left) and NP (right) are shown. Two‐tailed unpaired Student's t‐test were used to establish statistical significance. Data are expressed as means ±SD (standard deviation).*p<0.05.
Figure 4
Figure 4
Expansion of fibrotic clusters in diseased NP. A) Visualization of clustering by split UMAP plot of healthy (n = 3) versus diseased (n = 8) NP samples. B) Quantification of FC‐1 and FC‐1 subsets in healthy versus diseased NP. Data are shown as percentage of total cells for each condition. ****p<0.0001 by comparison of proportions tests. (C,E) Metascape analysis of gene markers of FC‐1 C) and FC‐2 E). (D,F) FN1 and GAS6 are among the top DEGs in diseased NP compared to healthy in FC‐1 D) and FC‐2 F). G,H) IHC for FN1 (G) and GAS6 (H) was performed on healthy (grade II, n = 4) and diseased (grade III‐IV, n = 6) NP tissues. Counterstaining was performed using methyl green to calculate percentages of positive cells verses total cell numbers. Red arrows indicate examples for positive cells and blue arrows show negative cells. Scale bars indicate 200 µm. I) Quantifications of cells positive for FN1 and GAS6 in healthy (n = 4) versus diseased (n = 6) NP are shown. Two‐tailed unpaired Student's t‐test were used to establish statistical significance. Data are expressed as means ±SD (standard deviation).** p <0.01, *** p <0.001. J) qPCR showing FN1 and GAS6 mRNA abundance in whole healthy (grade II, n = 4) versus diseased (grade III‐IV, n = 7) NP. Data are relative to GAPDH. Two‐tailed unpaired Student's t‐test were used to establish statistical significance. Data are expressed as means ±SD (standard deviation). *p <0.05.
Figure 5
Figure 5
The expanded fibrotic clusters are critical regulators of THBS signaling in NP. A,C) Circle plot showing direction (A) and heat map (C) showing role importance in the four CellChat‐defined centrality measures in the THBS signaling pathway in all clusters in NP. B) Genes involved in THBS signaling network and their relative expression levels in each NP cluster. D) Overall outgoing and incoming signal strength of each cluster in the THBS signaling network visualized in a scatter plot. E,F) Significance of each ligand‐receptor (L‐R) signaling interaction comprising “THBS” signaling network in NP. FC‐1 (E) and FC‐2 (F) were set as the sources of the signal. G) THBS1 is DE in diseased NP compared to healthy in FC‐1 (top) and FC‐2 (bottom). H) qPCR showing THBS1 and CD47 mRNA abundance in healthy (grade II, n = 4) versus diseased (grade III‐IV, n = 7) NP. Data are relative to GAPDH. Two‐tailed unpaired Student's t‐test were used to establish statistical significance. Data are expressed as means ±SD (standard deviation). *p <0.05. I) IHC for THBS1 and staining was performed on healthy (grade II, n = 4) and diseased (grade III‐IV, n = 6) NP tissues. Counterstaining was performed using methyl green to calculate percentages of positive cells verses total cell numbers. Red arrows indicate examples for positive cells and blue arrows show negative cells. Scale bars indicate 200 µm.
Figure 6
Figure 6
THBS is a pathogenic signal in NP. A) PCA plot showing separation by condition (left, control versus TSP‐1) and donor (right, donor 1 versus donor 2). B) Heat map showing correlations of condition and donor with each principal component. C) Volcano plot showing DEGs in control versus TSP‐1 treated NP cells. D) Hallmark gene set enrichment analysis of the DEGs. Genes were ranked by DESeq2 “stat” value (Wald statistic, log2FC divided by standard error). Significantly enriched pathways (padj <0.05) are indicated in blue. E–H) Enrichment plots showing significantly enriched pathways from GSEA (HALLMARK_COAGULATION; HALLMARK_CHOLESTEROL_HOMEOSTASIS; HALLMARK_PI3K_AKT_MTOR_SIGNALING; HALLMARK_TGF_BETA_SIGNALING). Enrichment plots show the gene set name (top), the running enrichment score (green curve) and the positions of the gene set hits on the rank ordered list in GSEA (black bars). I) Box plots showing DESeq2 counts for genes involved in TGFb/fibrosis signaling from control or TSP‐1 treated NP cells (n = 2 donors with n = 2 technical replicates/donors). Line at the median.
Figure 7
Figure 7
Identification of an expanded, disease‐associated chondrocyte population in AF. A) Visualization of clustering by split UMAP plot of healthy (n = 3) versus diseased (n = 10) AF samples. The disease‐associated chondrocyte (DAC) subset is shown in black boxes. B) Quantification of the DAC subset in healthy versus diseased AF. Data are shown as percentage of total cells for each condition. ****p<0.0001 by comparison of proportions tests. Healthy = grade II; Diseased = grade II‐III, grade III and grade III‐IV. (C, D) Lists of genes composing individual cluster signatures were established based on previously published literature (Table S2, Supporting Information). The Seurat command AddModuleScore was used to add a signature score to each individual cell in the integrated Seurat object based on mean expression of the genes in the signature lists. These scores were then visualized in violin plots split by cluster. Chondrocyte C) and fibroblast D) signatures are visualized for respective AF clusters. E) UMAPs showing SCT normalized counts of top markers for the DAC: FGFBP2, COMP, CNMD, SERPINA1, SNORC, APOD, RGCC, COL2A1 and COL9A3. F) Functional enrichment analysis using Metascape of the 138 significant markers of the DAC. G,I) Metascape analyses of the genes upregulated (G) and downregulated (I) in diseased compared to healthy in the DAC. H,J) Biological processes and DEGs annotated for these processes in upregulated (H) and downregulated (J) in the DAC.
Figure 8
Figure 8
The DAC is stem cell‐derived. A) Clustree analysis showing clustering patterns from resolutions 0 through 2. Resolution 0.5 was used for all analyses. The stem cell (SC) subset and DAC are marked with black boxes. (B‐D) Monocle3 analysis revealed pseudotime trajectories with the DAC B), stem cell C) and progenitor cell D) populations set as root nodes. All AF cells were involved in reconstructing the trajectories. Root nodes are indicated by white circles. E) Heat map showing aggregated expression of modules containing genes with high variation between clusters in AF. F,G) Metascape analyses of genes in modules 5 (F) and 1 (G). Top 10 genes in each module (ranked by Moran's I) are shown.
Figure 9
Figure 9
FOXO1 and FOXO3 are critical regulons in the DAC. A) pySCENIC analysis revealed FOXO1 and FOXO3 as enriched regulons in the DAC in AF. Relative regulon activity (AUC score) is shown for each regulon for each cluster in a heat map. B) FOXO1 regulon activity visualized in a split UMAP plot of healthy versus diseased AF. The DAC is shown in a black box. C) Functional enrichment analysis using Metascape of the 450 genes part of the FOXO1 regulon. D) FOXO1 skeletal system development (GO:0 001501) gene regulatory network (GRN) as visualized in a Cytoscape plot. E) FOXO3 regulon activity visualized in a split UMAP plot of healthy versus diseased AF. The stem cell subset and the DAC are shown in black boxes. F) Functional enrichment analysis using Metascape of the 89 genes part of the FOXO3 regulon. G) FOXO3 GRN as visualized in a Cytoscape plot.
Figure 10
Figure 10
The DAC is a critical regulator of THBS signaling in AF. A,C) Circle plot showing direction (A) and heat map (C) showing role importance in the four CellChat‐defined centrality measures in the THBS signaling pathway in all clusters in AF. B) Genes involved in THBS signaling network and their relative expression levels in each AF cluster. D) Overall outgoing and incoming signal strength of each cluster in the THBS signaling network visualized in a scatter plot. E) Significance of each ligand‐receptor (L‐R) signaling interaction comprising “THBS” signaling network in AF. The DAC was set as the source of the signal. F) qPCR showing COMP, THBS1 and CD47 mRNA abundance in whole healthy (grade II, n = 4) versus diseased (grade III‐IV, n = 7) AF. Data are relative to GAPDH. Two‐tailed unpaired Student's t‐test were used to establish statistical significance. Data are expressed as means ±SD (standard deviation). *p <0.05. G) IHC for THBS1 and staining was performed on healthy (grade II, n = 4) and diseased (grade III‐IV, n = 6) AF tissues. Counterstaining was performed using methyl green to calculate percentages of positive cells verses total cell numbers. Red arrows indicate examples for positive cells and blue arrows show negative cells. Scale bars indicate 200 µm.

References

    1. Vos T., Flaxman A. D., Naghavi M., Lozano R., Michaud C., Ezzati M., Shibuya K., Salomon J. A., Abdalla S., Aboyans V., Lancet 2012, 380, 2163.
    1. a) Katz J. N., JBJS 2006, 88, 21;
    2. b) Martin B. I., Deyo R. A., Mirza S. K., Turner J. A., Comstock B. A., Hollingworth W., Sullivan S. D., JAMA, J. Am. Med. Assoc. 2008, 299, 656. - PubMed
    1. a) Miller J. A., Schmatz C., Schultz A., Spine 1988, 13, 173; - PubMed
    2. b) Paajanen H., Erkintalo M., Parkkola R., Salminen J., Kormano M., Arch. Orthop. Trauma Surg. 1997, 116, 106. - PubMed
    1. Hirsch C., Ingelmark B.‐E., Miller M., Acta Orthop. Scand. 1963, 33, 1. - PubMed
    1. Manchikanti L., Singh V., Falco F. J., Benyamin R. M., Hirsch J. A., Neuromodul.: Technol. Neur. Interface 2014, 17, 3.

Publication types