

Comparing the current short-term cancer incidence prediction models in Brazil with state-of-the-art time-series models
- PMID: 38403643
- PMCID: PMC10894878
- DOI: 10.1038/s41598-024-55230-2
Comparing the current short-term cancer incidence prediction models in Brazil with state-of-the-art time-series models
Abstract
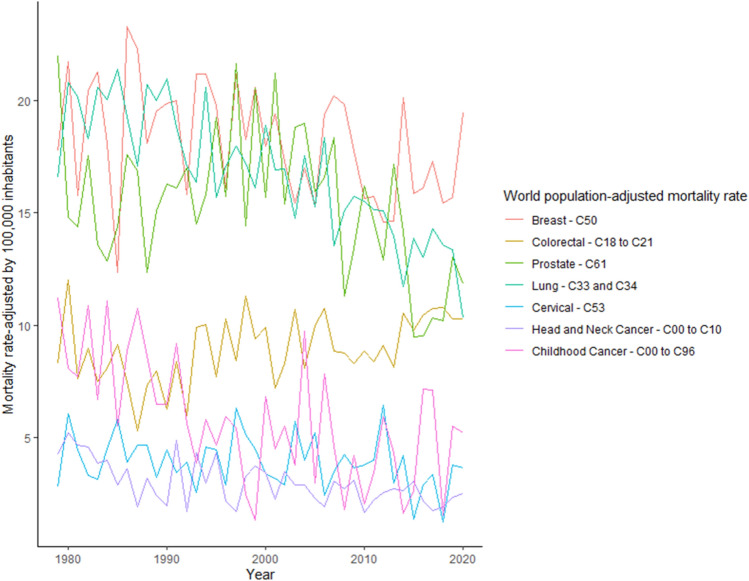
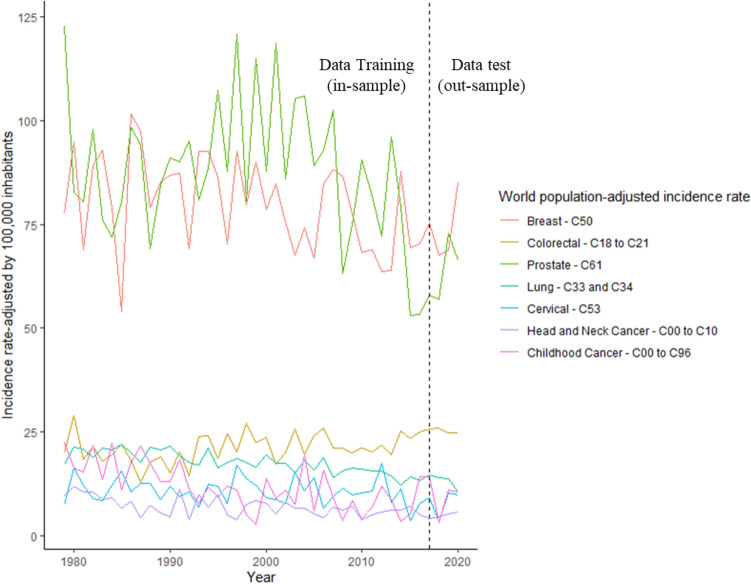
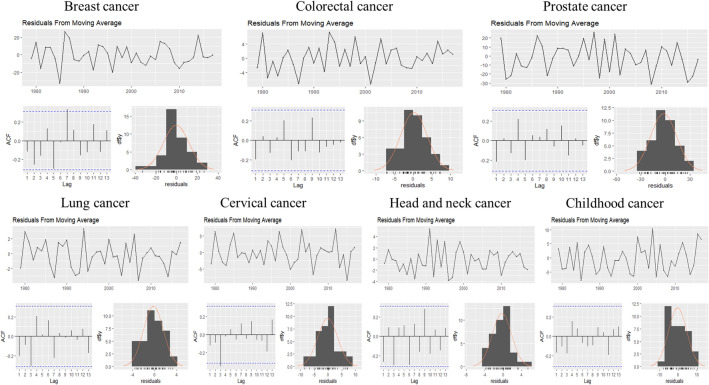
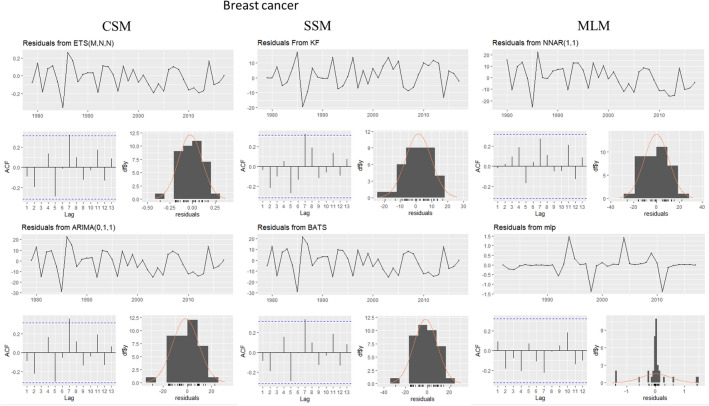
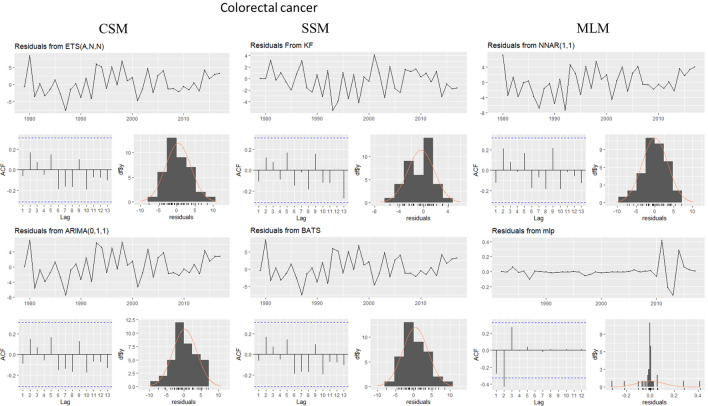
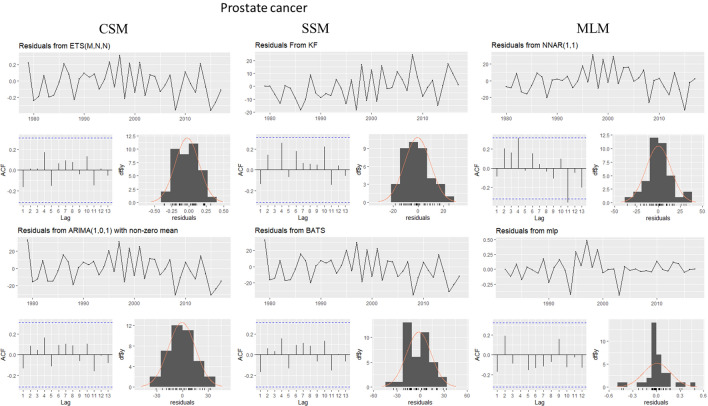
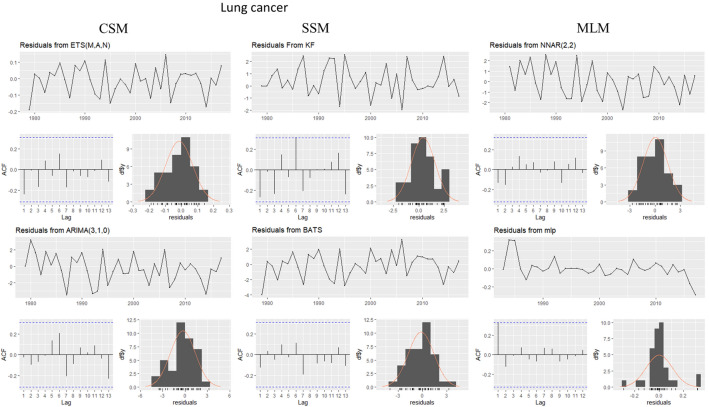
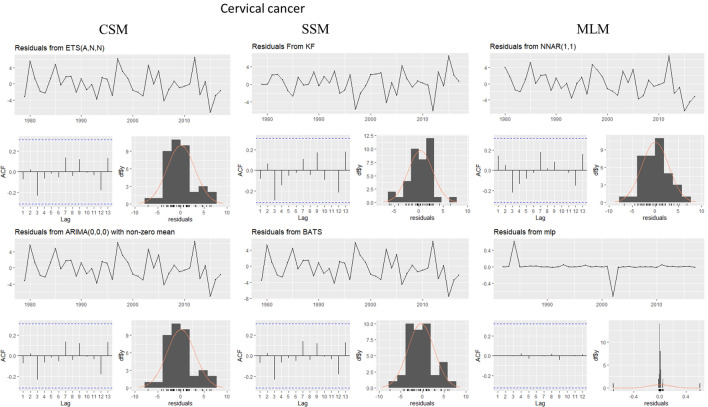
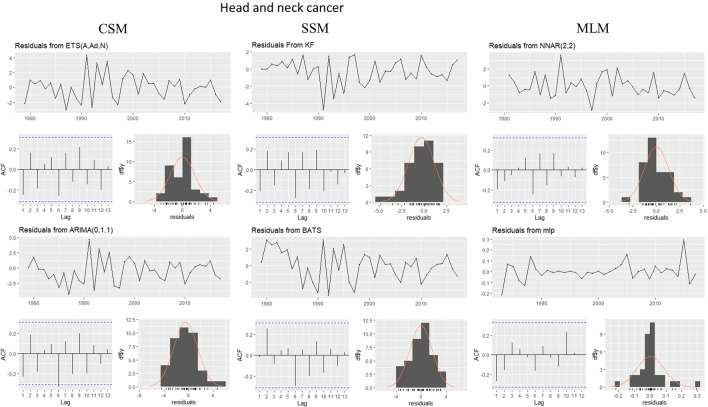
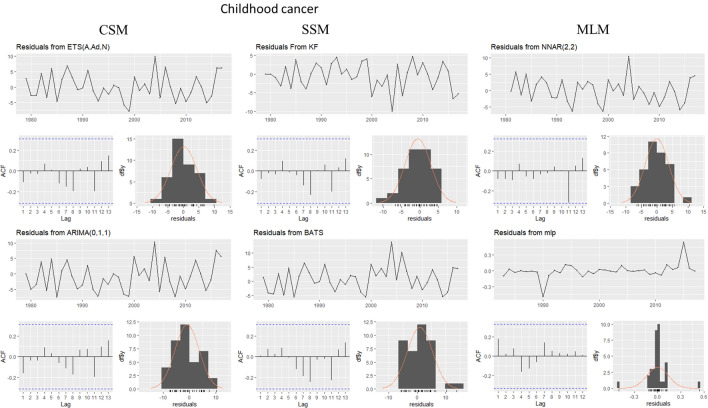
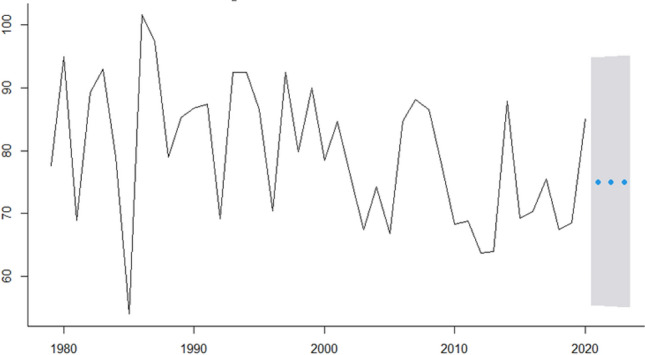
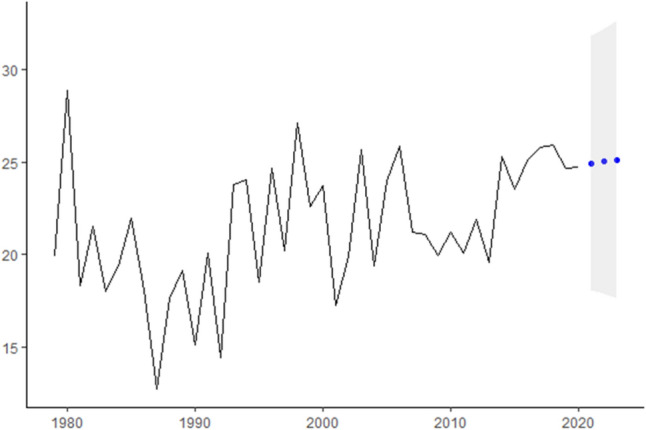
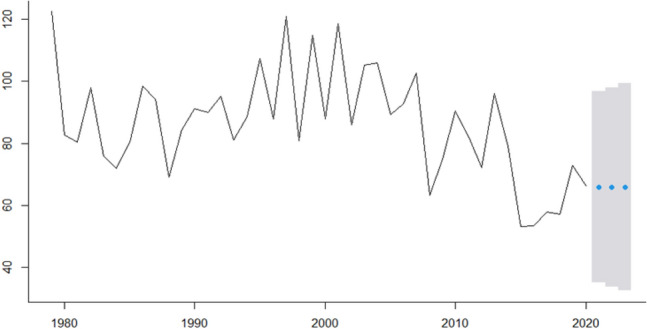
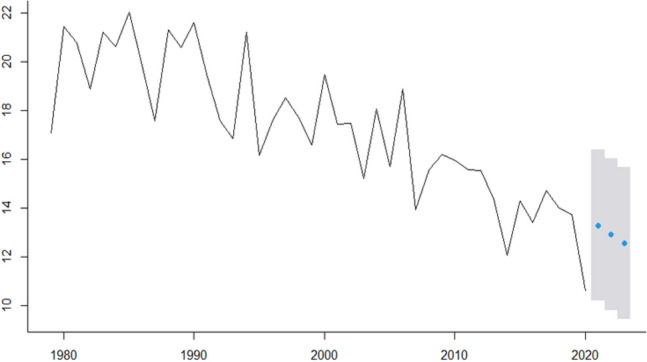
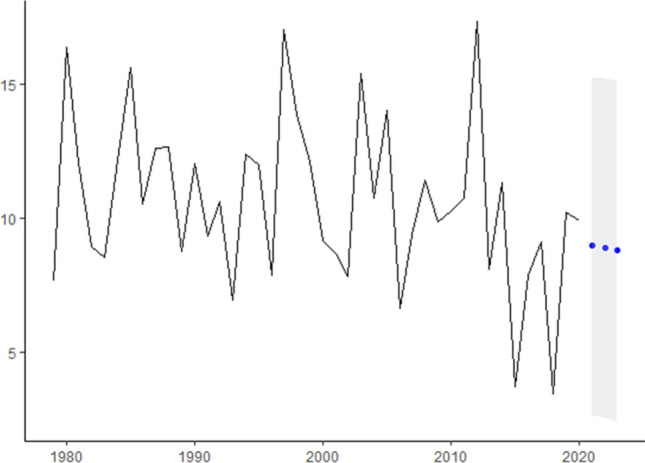
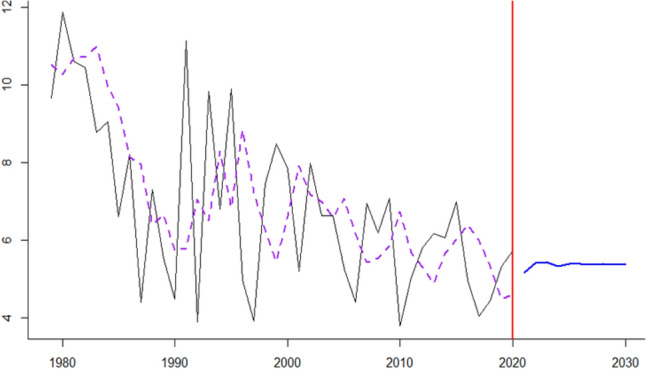
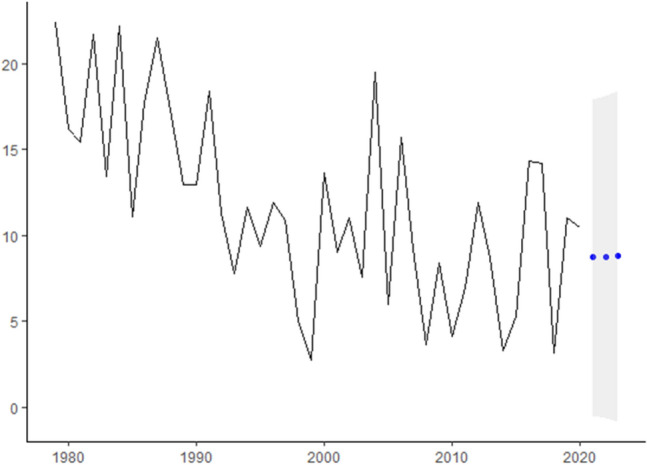
The World Health Organization has highlighted that cancer was the second-highest cause of death in 2019. This research aims to present the current forecasting techniques found in the literature, applied to predict time-series cancer incidence and then, compare these results with the current methodology adopted by the Instituto Nacional do Câncer (INCA) in Brazil. A set of univariate time-series approaches is proposed to aid decision-makers in monitoring and organizing cancer prevention and control actions. Additionally, this can guide oncological research towards more accurate estimates that align with the expected demand. Forecasting techniques were applied to real data from seven types of cancer in a Brazilian district. Each method was evaluated by comparing its fit with real data using the root mean square error, and we also assessed the quality of noise to identify biased models. Notably, three methods proposed in this research have never been applied to cancer prediction before. The data were collected from the INCA website, and the forecast methods were implemented using the R language. Conducting a literature review, it was possible to draw comparisons previous works worldwide to illustrate that cancer prediction is often focused on breast and lung cancers, typically utilizing a limited number of time-series models to find the best fit for each case. Additionally, in comparison to the current method applied in Brazil, it has been shown that employing more generalized forecast techniques can provide more reliable predictions. By evaluating the noise in the current method, this research shown that the existing prediction model is biased toward two of the studied cancers Comparing error results between the mentioned approaches and the current technique, it has been shown that the current method applied by INCA underperforms in six out of seven types of cancer tested. Moreover, this research identified that the current method can produce a biased prediction for two of the seven cancers evaluated. Therefore, it is suggested that the methods evaluated in this work should be integrated into the INCA cancer forecast methodology to provide reliable predictions for Brazilian healthcare professionals, decision-makers, and oncological researchers.
© 2024. The Author(s).
Conflict of interest statement
The authors declare no competing interests.
Figures
Similar articles
-
Artificial Intelligence based accurately load forecasting system to forecast short and medium-term load demands.Math Biosci Eng. 2020 Dec 4;18(1):400-425. doi: 10.3934/mbe.2021022. Math Biosci Eng. 2020. PMID: 33525099
-
Forecasting the new case detection rate of leprosy in four states of Brazil: A comparison of modelling approaches.Epidemics. 2017 Mar;18:92-100. doi: 10.1016/j.epidem.2017.01.005. Epidemics. 2017. PMID: 28279460 Free PMC article.
-
Comparing Short-Term Univariate and Multivariate Time-Series Forecasting Models in Infectious Disease Outbreak.Bull Math Biol. 2022 Dec 24;85(1):9. doi: 10.1007/s11538-022-01112-5. Bull Math Biol. 2022. PMID: 36565344 Free PMC article.
-
Breast and gynecologic cancers as a Brazilian health priority.Rev Assoc Med Bras (1992). 2023 Aug 4;69(suppl 1):e2023S120. doi: 10.1590/1806-9282.2023S120. eCollection 2023. Rev Assoc Med Bras (1992). 2023. PMID: 37556639 Free PMC article. Review.
-
Avoiding and identifying errors in health technology assessment models: qualitative study and methodological review.Health Technol Assess. 2010 May;14(25):iii-iv, ix-xii, 1-107. doi: 10.3310/hta14250. Health Technol Assess. 2010. PMID: 20501062 Review.
References
-
- Montgomery DC, Jennings CL, Kulahci M. Introduction to Time Series Analysis and Forecasting. Wiley; 2015.
-
- Yule GU. Vii. On a Method of Investigating Periodicities in Disturbed Series, with Special Reference to Wolfer's Sunspot Numbers. Philos. Trans. R. Soc. Lond. Series A Contain. Pap. Math. Phys. Character. 1927;226(636–646):267–298.
-
- Holt, C. Forecasting seasonals and trends by exponentially weighted averages (ONR memorandum no. 52). Vol. 10 (Carnegie Institute of Technology, 1957).
-
- Brown RG. Statistical Forecasting for Inventory Control. McGraw/Hill; 1959.
-
- Winters PR. Forecasting sales by exponentially weighted moving averages. Manage. Sci. 1960;6(3):324–342. doi: 10.1287/mnsc.6.3.324. - DOI
Publication types
MeSH terms
Grants and funding
LinkOut - more resources
Full Text Sources
Medical
