

Dietary patterns associated with the incidence of hypertension among adult Japanese males: application of machine learning to a cohort study
- PMID: 38403812
- PMCID: PMC11139695
- DOI: 10.1007/s00394-024-03342-w
Dietary patterns associated with the incidence of hypertension among adult Japanese males: application of machine learning to a cohort study
Abstract
Purpose: The previous studies that examined the effectiveness of unsupervised machine learning methods versus traditional methods in assessing dietary patterns and their association with incident hypertension showed contradictory results. Consequently, our aim is to explore the correlation between the incidence of hypertension and overall dietary patterns that were extracted using unsupervised machine learning techniques.
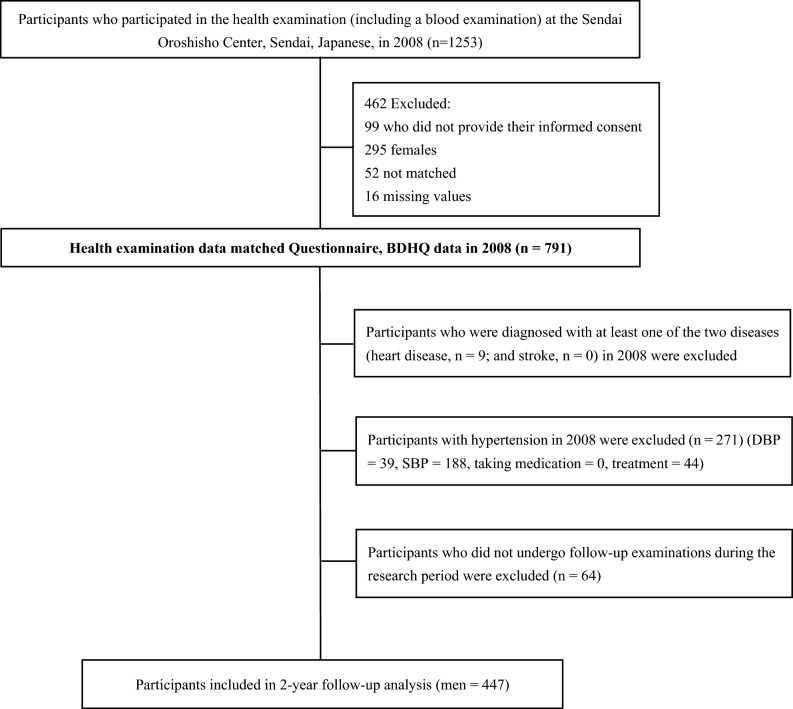
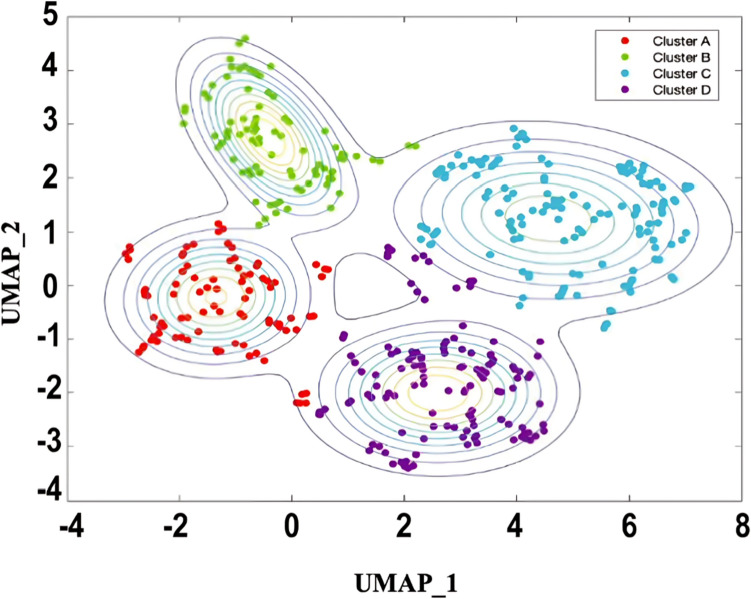
Methods: Data were obtained from Japanese male participants enrolled in a prospective cohort study between August 2008 and August 2010. A final dataset of 447 male participants was used for analysis. Dimension reduction using uniform manifold approximation and projection (UMAP) and subsequent K-means clustering was used to derive dietary patterns. In addition, multivariable logistic regression was used to evaluate the association between dietary patterns and the incidence of hypertension.
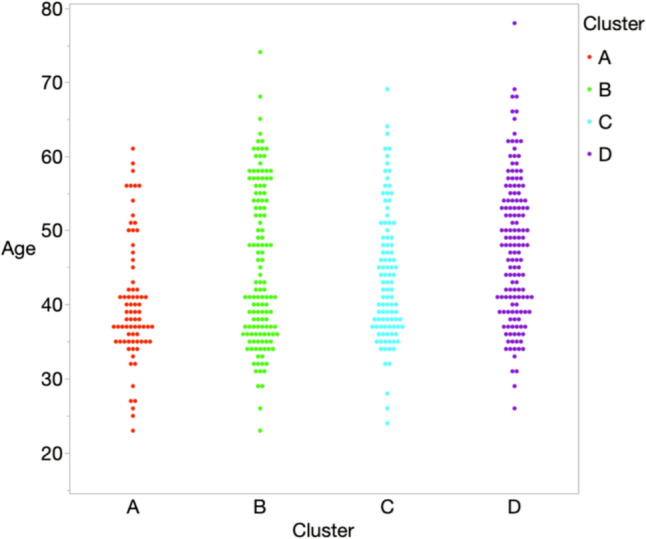
Results: We identified four dietary patterns: 'Low-protein/fiber High-sugar,' 'Dairy/vegetable-based,' 'Meat-based,' and 'Seafood and Alcohol.' Compared with 'Seafood and Alcohol' as a reference, the protective dietary patterns for hypertension were 'Dairy/vegetable-based' (OR 0.39, 95% CI 0.19-0.80, P = 0.013) and the 'Meat-based' (OR 0.37, 95% CI 0.16-0.86, P = 0.022) after adjusting for potential confounding factors, including age, body mass index, smoking, education, physical activity, dyslipidemia, and diabetes. An age-matched sensitivity analysis confirmed this finding.
Conclusion: This study finds that relative to the 'Seafood and Alcohol' pattern, the 'Dairy/vegetable-based' and 'Meat-based' dietary patterns are associated with a lower risk of hypertension among men.
Keywords: Dietary patterns; Hypertension; K-means; UMAP; Unsupervised machine learning.
© 2024. The Author(s).
Conflict of interest statement
The authors declare that they have no conflict of interests.
Figures
Similar articles
-
Dietary pattern and its association with blood pressure and blood lipid profiles among Japanese adults in the 2012 Japan National Health and Nutrition Survey.Asia Pac J Clin Nutr. 2018;27(5):1048-1061. doi: 10.6133/apjcn.072018.04. Asia Pac J Clin Nutr. 2018. PMID: 30272853
-
Meal-specific dietary patterns and their contribution to overall dietary patterns in the Japanese context: Findings from the 2012 National Health and Nutrition Survey, Japan.Nutrition. 2019 Mar;59:108-115. doi: 10.1016/j.nut.2018.07.110. Epub 2018 Aug 22. Nutrition. 2019. PMID: 30471523
-
Association between dietary behavior and risk of hypertension among Japanese male workers.Hypertens Res. 2013 Apr;36(4):374-80. doi: 10.1038/hr.2012.205. Epub 2013 Jan 10. Hypertens Res. 2013. PMID: 23303292
-
Dietary patterns and cardiovascular disease mortality in Japan: a prospective cohort study.Int J Epidemiol. 2007 Jun;36(3):600-9. doi: 10.1093/ije/dym005. Epub 2007 Feb 22. Int J Epidemiol. 2007. PMID: 17317693
-
Dietary patterns and hypertension in Chinese adults: a systematic review and meta-analysis.Front Public Health. 2025 May 7;13:1539359. doi: 10.3389/fpubh.2025.1539359. eCollection 2025. Front Public Health. 2025. PMID: 40401063 Free PMC article.
Cited by
-
Associations of ACE I/D and AGTR1 rs5182 polymorphisms with diabetes and their effects on lipids in an elderly Chinese population.Lipids Health Dis. 2024 Jul 30;23(1):231. doi: 10.1186/s12944-024-02222-w. Lipids Health Dis. 2024. PMID: 39080710 Free PMC article.
References
-
- Cardiovascular diseases (CVDs). https://www.who.int/news-room/fact-sheets/detail/cardiovascular-diseases...). Accessed 21 June 2021.
-
- Umemura S, Arima H, Arima S, Asayama K, Dohi Y, Hirooka Y, Horio T, Hoshide S, Ikeda S, Ishimitsu T, Ito M, Ito S, Iwashima Y, Kai H, Kamide K, Kanno Y, Kashihara N, Kawano Y, Kikuchi T, Kitamura K, Kitazono T, Kohara K, Kudo M, Kumagai H, Matsumura K, Matsuura H, Miura K, Mukoyama M, Nakamura S, Ohkubo T, Ohya Y, Okura T, Rakugi H, Saitoh S, Shibata H, Shimosawa T, Suzuki H, Takahashi S, Tamura K, Tomiyama H, Tsuchihashi T, Ueda S, Uehara Y, Urata H, Hirawa N. The Japanese Society of Hypertension Guidelines for the Management of Hypertension (JSH 2019) Hypertens Res. 2019;42(9):1235–1481. doi: 10.1038/s41440-019-0284-9. - DOI - PubMed
MeSH terms
Grants and funding
LinkOut - more resources
Full Text Sources
Medical
