

Development and prenatal exposure to androgens alter potassium currents in gonadotropin-releasing hormone neurons from female mice
- PMID: 38403894
- PMCID: PMC10939810
- DOI: 10.1111/jne.13373
Development and prenatal exposure to androgens alter potassium currents in gonadotropin-releasing hormone neurons from female mice
Abstract
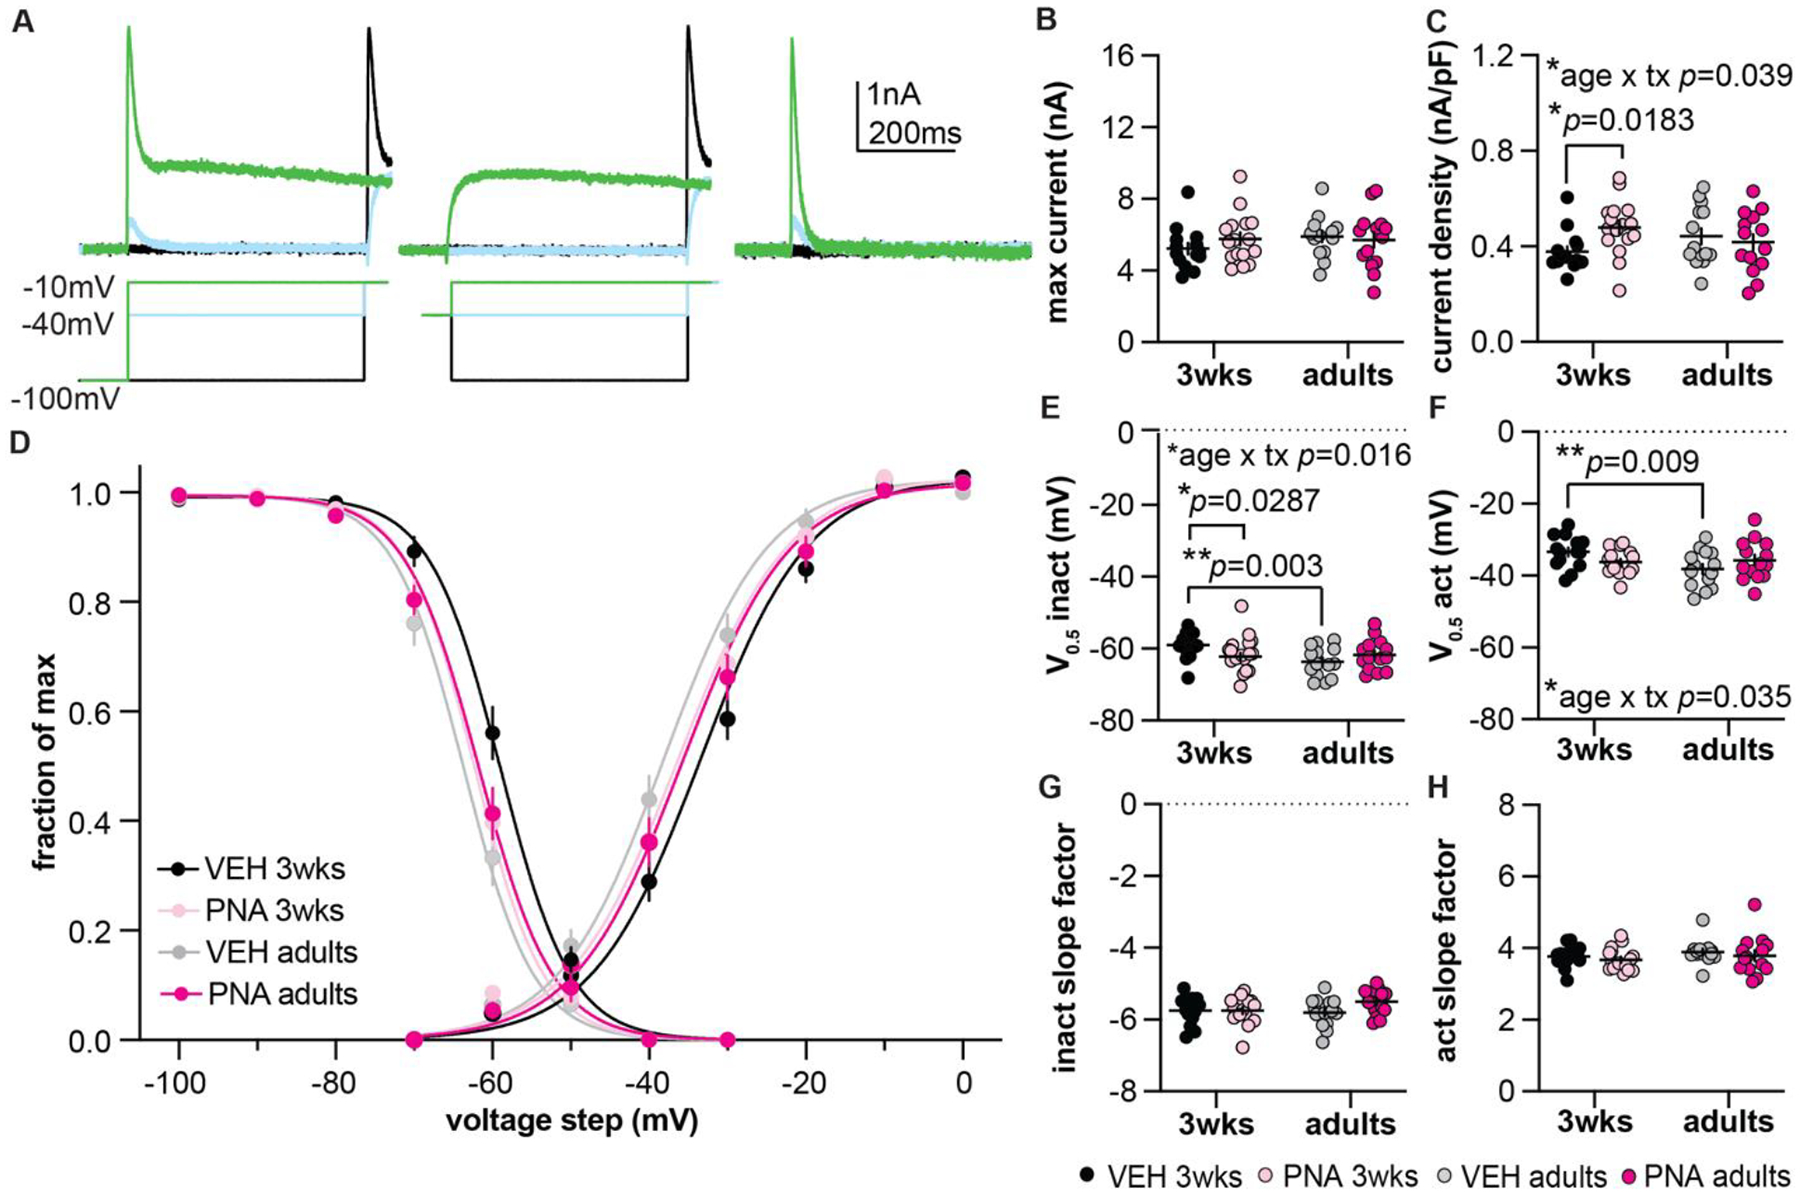
Pulsatile gonadotropin-releasing hormone (GnRH) release is critical for reproduction. Disruptions to GnRH secretion patterns may contribute to polycystic ovary syndrome (PCOS). Prenatally androgenized (PNA) female mice recapitulate many neuroendocrine abnormalities observed in PCOS patients. PNA and development induce changes in spontaneous GnRH neuron firing rate, response to synaptic input, and the afterhyperpolarization potential of the action potential. We hypothesized potassium currents are altered by PNA treatment and/or development. Whole-cell patch-clamp recordings were made of transient and residual potassium currents of GnRH neurons in brain slices from 3-week-old and adult control and PNA females. At 3 weeks of age, PNA treatment increased transient current density versus controls. Development and PNA altered voltage-dependent activation and inactivation of the transient current. In controls, transient current activation and inactivation were depolarized at 3 weeks of age versus in adulthood. In GnRH neurons from 3-week-old mice, transient current activation and inactivation were more depolarized in control than PNA mice. Development and PNA treatment interacted to shift the time-dependence of inactivation and recovery from inactivation. Notably, in cells from adult PNA females, recovery was prolonged compared to all other groups. Activation of the residual current occurred at more depolarized membrane potentials in 3-week-old than adult controls. PNA depolarized activation of the residual current in adults. These findings demonstrate the properties of GnRH neuron potassium currents change during typical development, potentially contributing to puberty, and further suggest PNA treatment may both alter some typical developmental changes and induce additional modifications, which together may underlie aspects of the PNA phenotype. There was not any clinical trial involved in this work.
Keywords: GnRH; androgens; polycystic ovary syndrome; puberty.
© 2024 The Authors. Journal of Neuroendocrinology published by John Wiley & Sons Ltd on behalf of British Society for Neuroendocrinology.
Conflict of interest statement
Figures


Similar articles
-
Prepubertal Development of GABAergic Transmission to Gonadotropin-Releasing Hormone (GnRH) Neurons and Postsynaptic Response Are Altered by Prenatal Androgenization.J Neurosci. 2018 Feb 28;38(9):2283-2293. doi: 10.1523/JNEUROSCI.2304-17.2018. Epub 2018 Jan 26. J Neurosci. 2018. PMID: 29374136 Free PMC article.
-
GnRH Neuron Excitability and Action Potential Properties Change with Development But Are Not Affected by Prenatal Androgen Exposure.eNeuro. 2022 Dec 7;9(6):ENEURO.0362-22.2022. doi: 10.1523/ENEURO.0362-22.2022. Print 2022 Nov-Dec. eNeuro. 2022. PMID: 36446571 Free PMC article.
-
Prepubertal Development of Gonadotropin-Releasing Hormone Neuron Activity Is Altered by Sex, Age, and Prenatal Androgen Exposure.Endocrinology. 2017 Nov 1;158(11):3943-3953. doi: 10.1210/en.2017-00768. Endocrinology. 2017. PMID: 28938422 Free PMC article.
-
The role of gonadotropin-releasing hormone neurons in polycystic ovary syndrome.J Neuroendocrinol. 2022 May;34(5):e13093. doi: 10.1111/jne.13093. Epub 2022 Jan 26. J Neuroendocrinol. 2022. PMID: 35083794 Free PMC article. Review.
-
Steroid regulation of GnRH neurons.Ann N Y Acad Sci. 2003 Dec;1007:143-52. doi: 10.1196/annals.1286.014. Ann N Y Acad Sci. 2003. PMID: 14993048 Review.
Cited by
-
Sirtuins, redox, and metabolic pathways in the brain of female PCOS mice.J Assist Reprod Genet. 2025 Jun 26. doi: 10.1007/s10815-025-03557-8. Online ahead of print. J Assist Reprod Genet. 2025. PMID: 40569550
References
-
- Clarke IJ & Cummins JT The temporal relationship between gonadotropin releasing hormone (GnRH) and luteinizing hormone (LH) secretion in ovariectomized ewes. Endocrinology 111, 1737–1739 (1982). https://doi.org:10.1210/endo-111-5-1737 - DOI - PubMed
-
- Moenter SM, Brand RM, Midgley AR & Karsch FJ Dynamics of gonadotropin-releasing hormone release during a pulse. Endocrinology 130, 503–510 (1992). https://doi.org:10.1210/endo.130.1.1727719 - DOI - PubMed
-
- Wildt L et al. Frequency and amplitude of gonadotropin-releasing hormone stimulation and gonadotropin secretion in the rhesus monkey. Endocrinology 109, 376–385 (1981). https://doi.org:10.1210/endo-109-2-376 - DOI - PubMed
-
- Haisenleder DJ, Dalkin AC, Ortolano GA, Marshall JC & Shupnik MA A pulsatile gonadotropin-releasing hormone stimulus is required to increase transcription of the gonadotropin subunit genes: evidence for differential regulation of transcription by pulse frequency in vivo. Endocrinology 128, 509–517 (1991). https://doi.org:10.1210/endo-128-1-509 - DOI - PubMed
-
- Legro RS Diagnostic criteria in polycystic ovary syndrome. Semin Reprod Med 21, 267–275 (2003). https://doi.org:10.1055/s-2003-43304 - DOI - PubMed
Publication types
MeSH terms
Substances
Grants and funding
LinkOut - more resources
Full Text Sources
Medical
Molecular Biology Databases
