

One-carbon metabolism nutrients impact the interplay between DNA methylation and gene expression in liver, enhancing protein synthesis in Atlantic salmon
- PMID: 38404006
- PMCID: PMC10900267
- DOI: 10.1080/15592294.2024.2318517
One-carbon metabolism nutrients impact the interplay between DNA methylation and gene expression in liver, enhancing protein synthesis in Atlantic salmon
Abstract
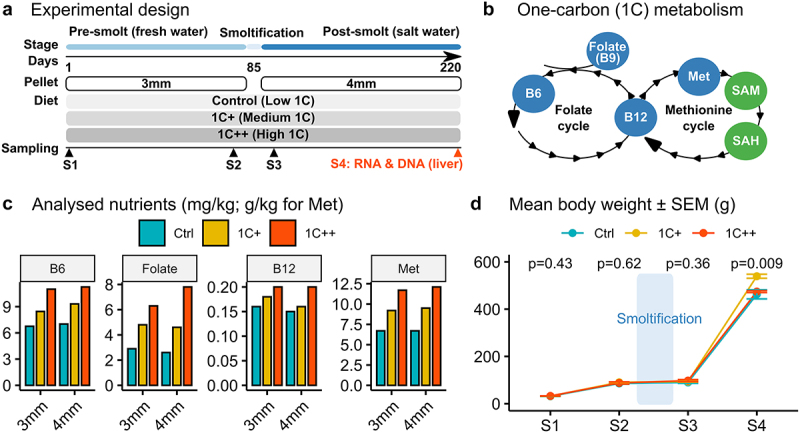
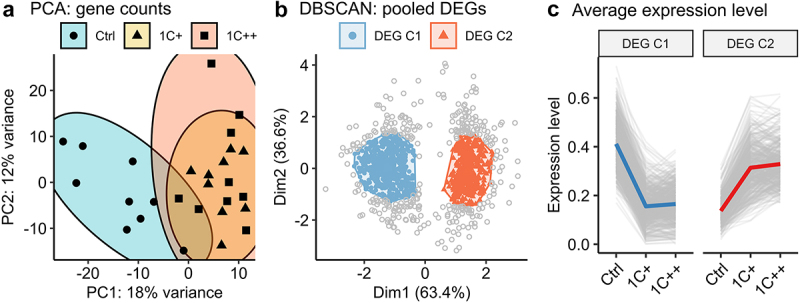
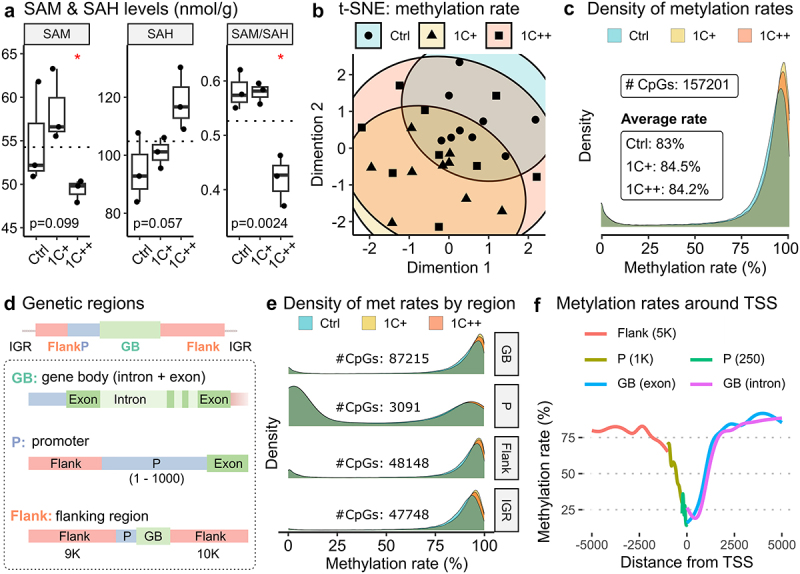
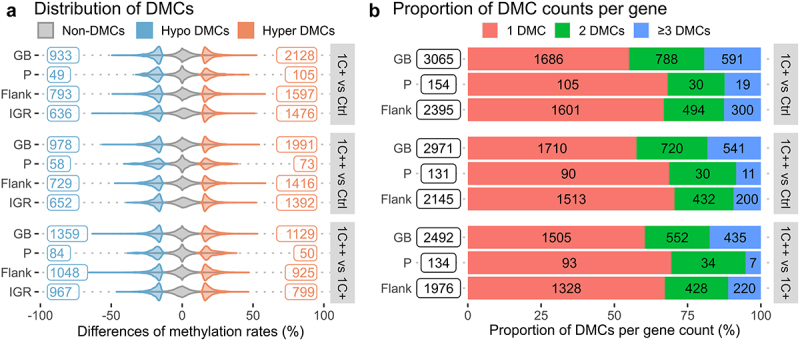
Supplementation of one-carbon (1C) metabolism micronutrients, which include B-vitamins and methionine, is essential for the healthy growth and development of Atlantic salmon (Salmo salar). However, the recent shift towards non-fish meal diets in salmon aquaculture has led to the need for reassessments of recommended micronutrient levels. Despite the importance of 1C metabolism in growth performance and various cellular regulations, the molecular mechanisms affected by these dietary alterations are less understood. To investigate the molecular effect of 1C nutrients, we analysed gene expression and DNA methylation using two types of omics data: RNA sequencing (RNA-seq) and reduced-representation bisulphite sequencing (RRBS). We collected liver samples at the end of a feeding trial that lasted 220 days through the smoltification stage, where fish were fed three different levels of four key 1C nutrients: methionine, vitamin B6, B9, and B12. Our results indicate that the dosage of 1C nutrients significantly impacts genetic and epigenetic regulations in the liver of Atlantic salmon, particularly in biological pathways related to protein synthesis. The interplay between DNA methylation and gene expression in these pathways may play an important role in the mechanisms underlying growth performance affected by 1C metabolism.
Keywords: B-vitamins; DNA methylation; Nutrition; SAM; methionine; omics; one-carbon metabolism; smoltification.
Conflict of interest statement
No potential conflict of interest was reported by the author(s).
Figures
Similar articles
-
Methionine: An Indispensable Amino Acid in Cellular Metabolism and Health of Atlantic Salmon.Aquac Nutr. 2023 Oct 27;2023:5706177. doi: 10.1155/2023/5706177. eCollection 2023. Aquac Nutr. 2023. PMID: 37927379 Free PMC article. Review.
-
Metabolic and molecular signatures of improved growth in Atlantic salmon (Salmo salar) fed surplus levels of methionine, folic acid, vitamin B6 and B12 throughout smoltification.Br J Nutr. 2022 May 14;127(9):1289-1302. doi: 10.1017/S0007114521002336. Epub 2021 Jun 25. Br J Nutr. 2022. PMID: 34176547
-
Out-of-season spawning affects the nutritional status and gene expression in both Atlantic salmon female broodstock and their offspring.Comp Biochem Physiol A Mol Integr Physiol. 2020 Sep;247:110717. doi: 10.1016/j.cbpa.2020.110717. Epub 2020 May 4. Comp Biochem Physiol A Mol Integr Physiol. 2020. PMID: 32376458
-
The effect of micronutrient supplementation on growth and hepatic metabolism in diploid and triploid Atlantic salmon (Salmo salar) parr fed a low marine ingredient diet.Comp Biochem Physiol B Biochem Mol Biol. 2019 Jan;227:106-121. doi: 10.1016/j.cbpb.2018.10.004. Epub 2018 Oct 24. Comp Biochem Physiol B Biochem Mol Biol. 2019. PMID: 30367964
-
Transcriptomic responses to functional feeds in Atlantic salmon (Salmo salar).Fish Shellfish Immunol. 2011 Nov;31(5):704-15. doi: 10.1016/j.fsi.2011.02.023. Epub 2011 Mar 4. Fish Shellfish Immunol. 2011. PMID: 21377530 Review.
Cited by
-
Causal Association Between 12 Micronutrients and Common Chronic Respiratory Diseases: A Bidirectional Two-Sample Mendelian Randomization Study.Genet Res (Camb). 2025 May 28;2025:7575005. doi: 10.1155/genr/7575005. eCollection 2025. Genet Res (Camb). 2025. PMID: 40469921 Free PMC article.
-
Altered spawning seasons of Atlantic salmon broodstock transcriptionally and epigenetically influence cell cycle and lipid-mediated regulations in their offspring.PLoS One. 2025 Feb 24;20(2):e0317770. doi: 10.1371/journal.pone.0317770. eCollection 2025. PLoS One. 2025. PMID: 39992963 Free PMC article.
-
Genomic context determines the effect of DNA methylation on gene expression in the gut epithelium of Atlantic salmon (Salmo salar).Epigenetics. 2024 Dec;19(1):2392049. doi: 10.1080/15592294.2024.2392049. Epub 2024 Aug 16. Epigenetics. 2024. PMID: 39151124 Free PMC article.
-
Methionine: An Indispensable Amino Acid in Cellular Metabolism and Health of Atlantic Salmon.Aquac Nutr. 2023 Oct 27;2023:5706177. doi: 10.1155/2023/5706177. eCollection 2023. Aquac Nutr. 2023. PMID: 37927379 Free PMC article. Review.
References
-
- Espe M, Vikesa V, Thomsen TH, et al. Atlantic salmon fed a nutrient package of surplus methionine, vitamin B12, folic acid and vitamin B6 improved growth and reduced the relative liver size, but when in excess growth reduced. Aquacult Nutr. 2020;26(2):477–89. PubMed PMID: WOS:000494524000001. doi: 10.1111/anu.13010 - DOI
-
- Hamre K, Sissener NH, Lock EJ, et al. Antioxidant nutrition in Atlantic salmon (Salmo salar) parr and post-smolt, fed diets with high inclusion of plant ingredients and graded levels of micronutrients and selected amino acids. PeerJ. 2016;4:e2688. PubMed PMID: WOS:000387171900012. doi: 10.7717/peerj.2688 - DOI - PMC - PubMed
MeSH terms
Substances
LinkOut - more resources
Full Text Sources
Other Literature Sources