

High-accuracy noninvasive continuous glucose monitoring using OCT angiography-purified blood scattering signals in human skin
- PMID: 38404306
- PMCID: PMC10890863
- DOI: 10.1364/BOE.506092
High-accuracy noninvasive continuous glucose monitoring using OCT angiography-purified blood scattering signals in human skin
Abstract
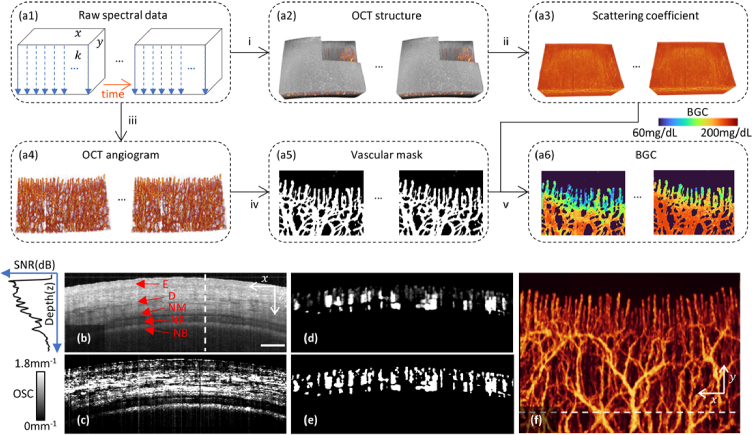
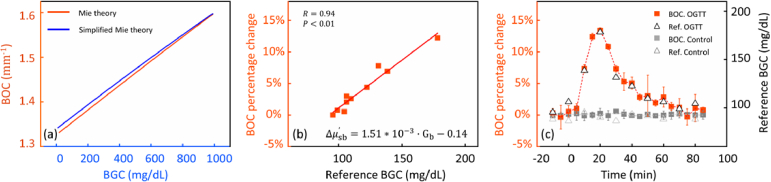
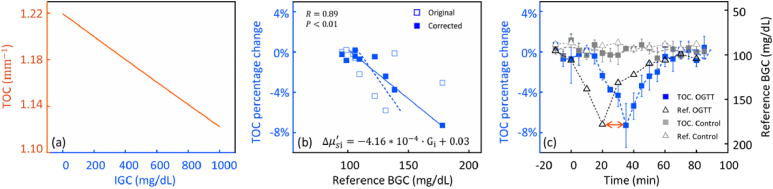
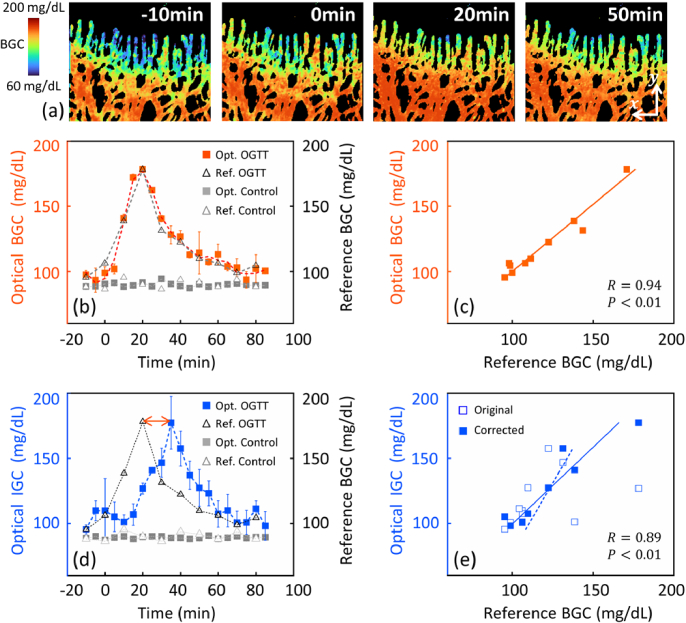
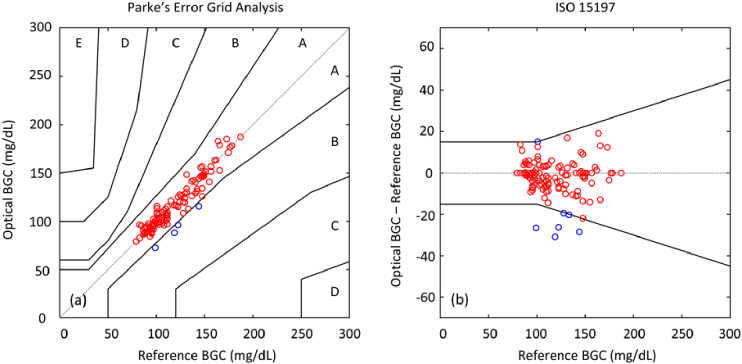
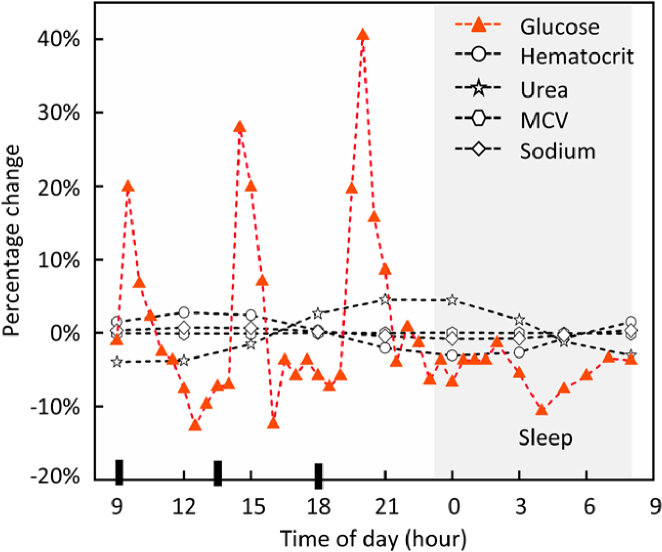
The accuracy of noninvasive continuous glucose monitoring (CGM) through near-infrared scattering is challenged by mixed scattering signals from different compartments, where glucose has a positive correlation with a blood scattering coefficient but a negative correlation with a tissue scattering coefficient. In this study, we developed a high-accuracy noninvasive CGM based on OCT angiography (OCTA)-purified blood scattering signals. The blood optical scattering coefficient (BOC) was initially extracted from the depth attenuation of backscattered light in OCT and then purified by eliminating the scattering signals from the surrounding tissues under the guidance of a 3D OCTA vascular map in human skin. The purified BOC was used to estimate the optical blood glucose concentration (BGC) through a linear calibration. The optical and reference BGC measurements were highly correlated (R = 0.94) without apparent time delay. The mean absolute relative difference was 6.09%. All optical BGC measurements were within the clinically acceptable Zones A + B, with 96.69% falling in Zone A on Parke's error grids. The blood glucose response during OGTT was mapped with a high spatiotemporal resolution of the single vessel and 5 seconds. This noninvasive OCTA-based CGM shows promising accuracy for clinical use. Future research will involve larger sample sizes and diabetic participants to confirm these preliminary findings.
© 2024 Optica Publishing Group.
Conflict of interest statement
The authors declared no potential conflicts of interest concerning the research, authorship, and publication of this article.
Figures
Similar articles
-
Two-dimensional correlation (2D) method for improving the accuracy of OCT-based noninvasive blood glucose concentration (BGC) monitoring.Lasers Med Sci. 2021 Oct;36(8):1649-1659. doi: 10.1007/s10103-021-03244-x. Epub 2021 Feb 1. Lasers Med Sci. 2021. PMID: 33523391
-
Noninvasive OCT angiography-based blood attenuation measurements correlate with blood glucose level in the mouse retina.Biomed Opt Express. 2021 Jul 6;12(8):4680-4688. doi: 10.1364/BOE.430104. eCollection 2021 Aug 1. Biomed Opt Express. 2021. PMID: 34513217 Free PMC article.
-
Optical coherence tomography-based continuous noninvasive glucose monitoring in patients with diabetes.Diabetes Technol Ther. 2008 Jun;10(3):188-93. doi: 10.1089/dia.2007.0277. Diabetes Technol Ther. 2008. PMID: 18473692
-
Optical coherence tomography based angiography [Invited].Biomed Opt Express. 2017 Jan 24;8(2):1056-1082. doi: 10.1364/BOE.8.001056. eCollection 2017 Feb 1. Biomed Opt Express. 2017. PMID: 28271003 Free PMC article. Review.
-
Optical coherence tomography angiography: A comprehensive review of current methods and clinical applications.Prog Retin Eye Res. 2017 Sep;60:66-100. doi: 10.1016/j.preteyeres.2017.07.002. Epub 2017 Jul 29. Prog Retin Eye Res. 2017. PMID: 28760677 Free PMC article. Review.
Cited by
-
Evaluation and Validation on Sensitivity of Near-Infrared Diffuse Reflectance in Non-Invasive Human Blood Glucose Measurement.Sensors (Basel). 2024 Sep 10;24(18):5879. doi: 10.3390/s24185879. Sensors (Basel). 2024. PMID: 39338624 Free PMC article.
-
High-speed, long-range and wide-field OCT for in vivo 3D imaging of the oral cavity achieved by a 600 kHz swept source laser.Biomed Opt Express. 2024 Jun 27;15(7):4365-4380. doi: 10.1364/BOE.528287. eCollection 2024 Jul 1. Biomed Opt Express. 2024. PMID: 39022551 Free PMC article.
-
Adaptive contour-tracking to aid wide-field swept-source optical coherence tomography imaging of large objects with uneven surface topology.Biomed Opt Express. 2024 Jul 29;15(8):4891-4908. doi: 10.1364/BOE.533399. eCollection 2024 Aug 1. Biomed Opt Express. 2024. PMID: 39347000 Free PMC article.
References
LinkOut - more resources
Full Text Sources