. 2024 Jan 25;15(2):1074-1088.
doi: 10.1364/BOE.510912. eCollection 2024 Feb 1.

Fast, multicolour optical sectioning over extended fields of view with patterned illumination and machine learning

Affiliations

Fast, multicolour optical sectioning over extended fields of view with patterned illumination and machine learning

Edward N Ward et al. Biomed Opt Express. .

Abstract

Structured illumination can reject out-of-focus signal from a sample, enabling high-speed and high-contrast imaging over large areas with widefield detection optics. However, this optical sectioning technique is currently limited by image reconstruction artefacts and poor performance at low signal-to-noise ratios. We combine multicolour interferometric pattern generation with machine learning to achieve high-contrast, real-time reconstruction of image data that is robust to background noise and sample motion. We validate the method in silico and demonstrate imaging of diverse specimens, from fixed and live biological samples to synthetic biosystems, reconstructing data live at 11 Hz across a 44 × 44μm2 field of view, and demonstrate image acquisition speeds exceeding 154 Hz.


Conflict of interest statement

The authors declare no conflicts of interest.

Figures

Fig. 1.
Fig. 1.
Optical layout for interferometric SIM pattern generation [13]. Three laser lines (L) with wavelengths 488 nm (Cobolt Calypso, 200 mW), 561 nm (Oxxius SLIM-561-150, 500 mW) and 647 nm (Toptica iBeam SMART, 100 mW) are combined coaxially and the beam is then expanded and collimated by two lenses (BEL1,2) to flatten the intensity across the field of view. A field stop (F) restricts the excited area of the sample to minimise unwanted photodamage. The excitation beam is focused by a focusing lens (FL, Thorlabs, AC254-150-A) and reflected by a D-shaped mirror (DM, Thorlabs, PFD10-03-F01) onto a galvanometric scan mirror (SM, Scanlab, dynAXIS-M) which directs the beam through a scan lens (SL, Thorlabs, AC508-150-A) and into the Michelson interferometer. The interferometer comprises a 2-inch 50:50 beam splitter cube (BS, Thorlabs, BS031) and a pair of 1/2-inch mirrors (Thorlabs, BB05-E01) mounted on micrometer translation stages (Thorlabs, XRN25C/M). The beamlets returning from the interferometer are descanned by the scan mirror and relayed to the microscope by a series of 150 mm focal length relay lenses (RL1−3, Thorlabs, AC508-150-A). Polarisation is controlled by a quarter wave plate (QWP, Thorlabs, AQWP05M-600) and linear polariser (LP). The two beamlets are then directed into the inverted microscope frame (Olympus, IX73) and onto the back focal plane of the objective lens (OL, Olympus, UPLSAPO60XW) through a tube lens (TL1, Thorlabs, TTL200A). The beamlets are focused by the objective so that they interfere in the sample plane to form a sinusoidal illumination pattern. Fluorescence signal is isolated with a quadband dichroic mirror (Di, Chroma, 405/488/561/647) and focused onto the detector (Det, PCO, edge 4.2bi). The fluorescence signal is separated into emission bands by two long-pass dichroic mirrors (Chroma, T635LPXR-UF2 and T560LPXR) enabling multiple colour channels to be imaged side-by-side on the detector.
Fig. 2.
Fig. 2.
Network architectures for machine learning reconstructions. A: Architecture for the video super-resolution (VSR) based network. The initial data is embedded into a multi-dimensional feature map which is then passed through a sequence of five windowed channel attention blocks (WCABs) and fused into a single reconstructed frame. B: Each WCAB consists of a sequence of Swin transformer layers with multi-head self attention (MSA) [18] followed by a residual channel attention block (RCAB) [19]. C: Each RCAB comprises a channel attention mechanism using global pooling and two convolution layers to calculate weights for the input channels. A residual connection is then added to ensure the continuity of low-frequency information through the network.
Fig. 3.
Fig. 3.
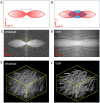
ML reconstruction of OS-SIM data recovers axial resolution and fills the missing cone. A: Schematic indicating the shape of the optical transfer function (OTF) of a widefield microscope in the kx,kz plane. B: Ideal OTF after OS-SIM reconstruction. Upon illumination with a stripe pattern, the low spatial frequency components (blue area) can be extracted and allocated to the correct location in frequency space. C: kx,kz projection of the widefield OTF from simulated OS-SIM imaging of point sources. The bright area indicates the supported spatial frequencies. In the kz direction, a cone of frequencies (yellow dashed line) is missing. These missing frequencies contain the axial information of the sample and this loss of information results in the poor background rejection seen in widefield imaging. D: Calculated OTF of VSR reconstruction of simulated OS-SIM images. Compared to C, the missing cone has now been filled, indicating that axial information has been recovered in the reconstruction. E: 3D perspective of simulated widefield imaging of a filament mesh. F: 3D perspective of VSR reconstruction of a simulated filament mesh.
Fig. 4.
Fig. 4.
Machine learning reconstructions, VSR and RCAN, outperform square difference (SD) reconstructions at low signal-to-noise ratios. A: Comparison of the simulated ground truth (GT) confocal image, a maximum intensity projection of 50 slices from the simulated 3D volume with no Poissonian noise added, and the raw data: the expected widefield image from a single frame, calculated as the mean of the 3 OS-SIM frames. B-D: Maximum intensity projections of the filtered SD, VSR and RCAN reconstructions, taken from 50 slices with a noise level η=2×10⁵ . Scale bars = 10 μm.
Fig. 5.
Fig. 5.
Error analysis of OS-SIM reconstruction methods. All methods decrease in performance as the signal level (Poisson factor, η ) decreases. At the noise levels tested, filtered SD outperforms basic SD at all levels and marginally outperforms VSR and RCAN reconstructions at the lowest noise levels. As noise increases, filtered SD shows a sharp drop in performance at η=1×10⁴ , vs η=2×10⁵ for the VSR approach. On these static samples, RCAN continues to perform reconstructions of comparable quality at levels down to η=5×10⁶ .
Fig. 6.
Fig. 6.
Comparison of reconstruction methods on dynamic OS-SIM data. A: Single frame from simulated imaging of a dynamic sample. Scale bar = 10 μm. B: Magnified view of the area indicated in A. The three input frames mimic a moving structure under shifting patterned illumination. C: (Top to bottom) ground truth (GT) ideal sectioning image; video super-resolution (VSR) reconstruction; squared difference (SD) reconstruction. Scale bar = 5 μm. D: Structural similarity (SSIM) scores for reconstruction methods averaged across eight reconstructions. Scores were calculated as the similarity between the reconstructed image and a model optically sectioned reconstruction GT. Error bars indicate the standard deviation in SSIM across all reconstructed images.
Fig. 7.
Fig. 7.
Comparison of optical sectioning structured illumination microscopy (OS-SIM) reconstruction methods to scanning confocal imaging. Machine learning (ML) outperforms classical methods and has comparable performance to confocal. A: Scanning confocal image of immunostained β -tubulin in fixed Vero cells. B: Comparison of widefield (WF) imaging to ML-OS-SIM reconstruction methods - video super-resolution (VSR) and residual channel attention network (RCAN) - and traditional reconstruction techniques: square difference (SD) [3], filtered SD [7] and corrected SD [6]. All techniques show an improvement in contrast and background rejection, however, classical methods are heavily impacted by noise, as seen in the top left corner of the images. In the SD reconstruction, the noise is amplified and the details of the sample are obscured. The filtered SD reconstruction removes this noise but at the expense of artefacts being introduced into the reconstruction. In comparison, the two ML-OS-SIM reconstructions successfully remove both the background and noise. C: Structural similarity index of the reconstructions to the corresponding confocal image averaged over six regions of the sample. Error bars show standard deviation in the similarity scores. All scale bars = 10 μm.
Fig. 8.
Fig. 8.
Machine learning optical sectioning structured illumination microscopy (ML-OS-SIM) produces optically sectioned volumes equivalent to scanning confocal microscopy at faster imaging speeds. Images show immunostained β -tubulin in fixed Vero cells imaged with A: deconvolved scanning confocal microscopy and B: ML-OS-SIM. Both techniques enable the 3D structure of the microtubule cytoskeleton to be resolved. Using ML-OS-SIM, the complete equivalent volume could be imaged and the reconstruction displayed to the user in < 2 s with a 50 ms exposure per frame compared to 2 min 36 s for scanning confocal microscopy. Timings were chosen to achieve similar sectioning performance. Colourmap indicates the z position. Scale bars = 10 μm.
Fig. 9.
Fig. 9.
Machine learning optical sectioning structured illumination microscopy (ML-OS-SIM) enables video-rate mapping of live COS-7 cells, labelled with MitoTracker Orange and SiR Lysosome and excited simultaneously with the laser lines λ=561 and 647nm . A: Single-channel volume projection of the mitochondrial network where the colourmap indicates the z position. Scale bar = 10 μm. B: Dynamic interaction of lysosomes (green) with mitochondria (purple). Image sequence shows a projection of 3 adjacent slices from the data. Scale bars = 2 μm.
Fig. 10.
Fig. 10.
Optical sectioning and multicolour interferometric structured illumination enable fast, high-contrast 3D imaging of the lateral re-organisation of membrane-bound DNA nanostructures in Giant Unilamellar Vesicles (Fig. S5) [29]. Images are 3D projections of volumetric data. A,B: Representative vesicles before (A) and 12 h after (B) fueling a biomimetic cargo transport pathway with nucleic-acid signals. A: In the initial configuration, the DNA (blue) and liquid disordered phase (yellow) overlap, indicating the preferential affinity of DNA nanostructures for liquid-disordered phases. B: Cargo transport relocates the fluorescent nanostructures to the liquid-ordered phase. ML-OS-SIM enables samples to be imaged in multiple colours simultaneously, preventing motion artefacts and temporal offsets in the reconstructions. Scale bars = 5 μm.

Similar articles

References

    1. Huisken J., Swoger J., Bene D., et al. , “Optical Sectioning Deep Inside Live Embryos by Selective Plane Illumination Microscopy,” Science 305(5686), 1007–1009 (2004).10.1126/science.1100035 - DOI - PubMed
    1. Tokunaga M., Imamoto N., Sakata-Sogawa K., “Highly inclined thin illumination enables clear single-molecule imaging in cells,” Nat. Methods 5(2), 159–161 (2008).10.1038/nmeth1171 - DOI - PubMed
    1. Neil M. A. A., Juškaitis R., Wilson T., “Method of obtaining optical sectioning by using structured light in a conventional microscope,” Opt. Lett. 22(24), 1905–1907 (1997).10.1364/OL.22.001905 - DOI - PubMed
    1. Heintzmann R., Cremer C. G., “Laterally modulated excitation microscopy: improvement of resolution by using a diffraction grating,” in Optical Biopsies and Microscopic Techniques III , vol. 3568 (SPIE, 1999), pp. 185–196.
    1. Gustafsson M. G. L., “Surpassing the lateral resolution limit by a factor of two using structured illumination microscopy,” J. Microsc. 198(2), 82–87 (2000).10.1046/j.1365-2818.2000.00710.x - DOI - PubMed

LinkOut - more resources