. 2024 Jan 12;15(8):2833-2847.
doi: 10.1039/d3sc05937e. eCollection 2024 Feb 22.

High-throughput drug target discovery using a fully automated proteomics sample preparation platform

Affiliations

High-throughput drug target discovery using a fully automated proteomics sample preparation platform

Qiong Wu et al. Chem Sci. .

Abstract

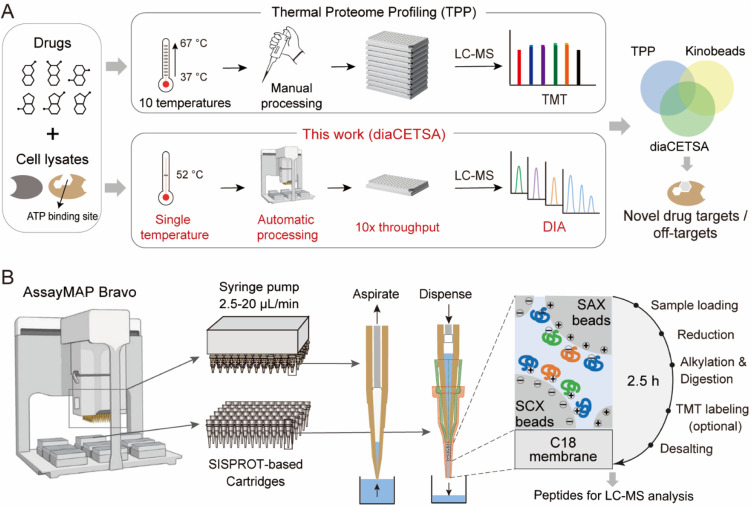
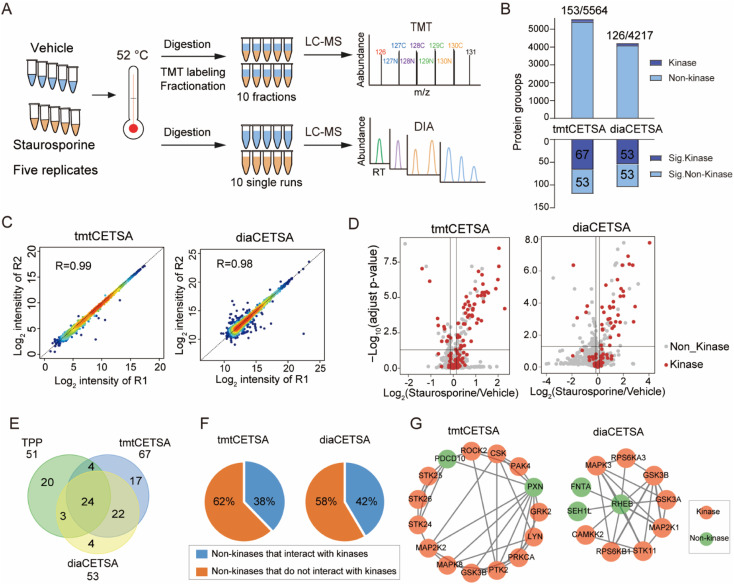
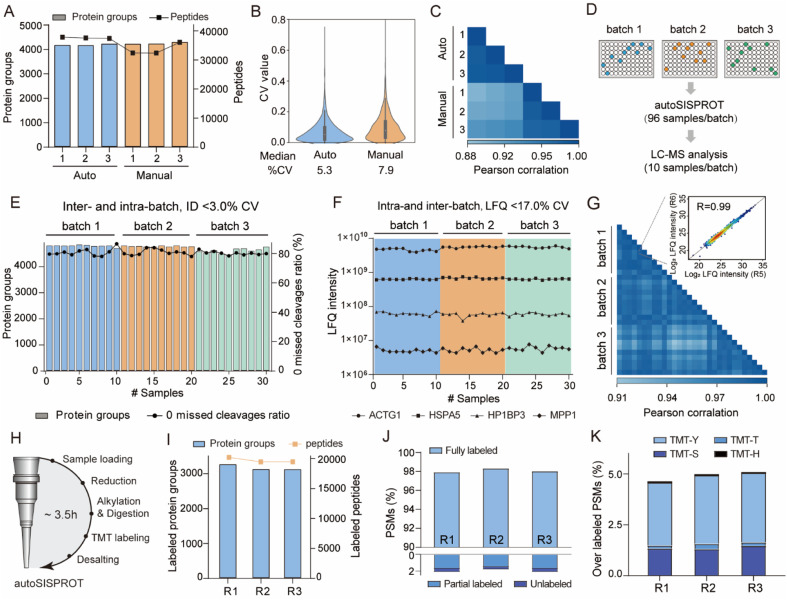
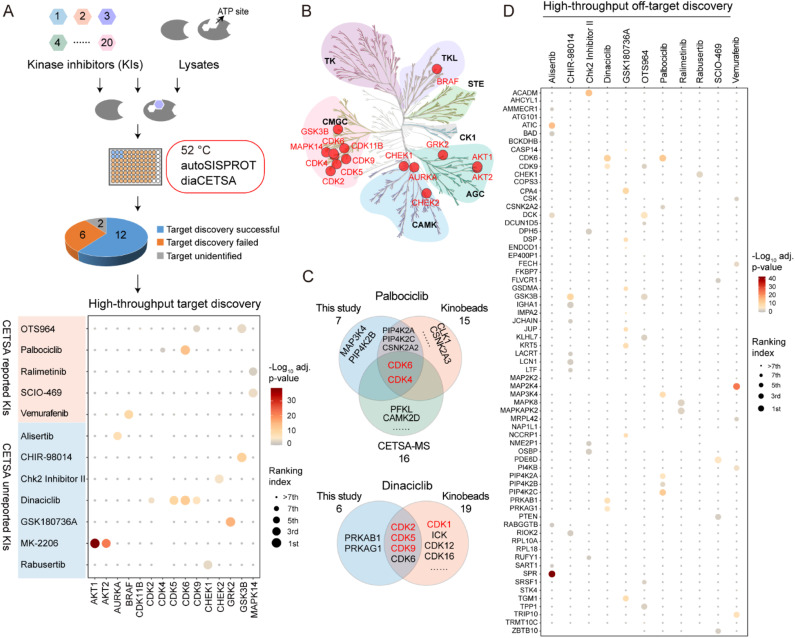
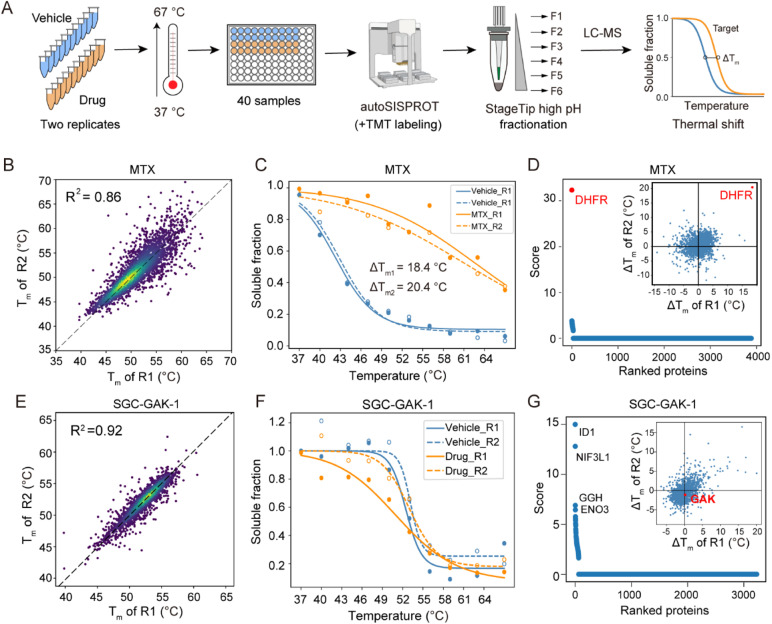
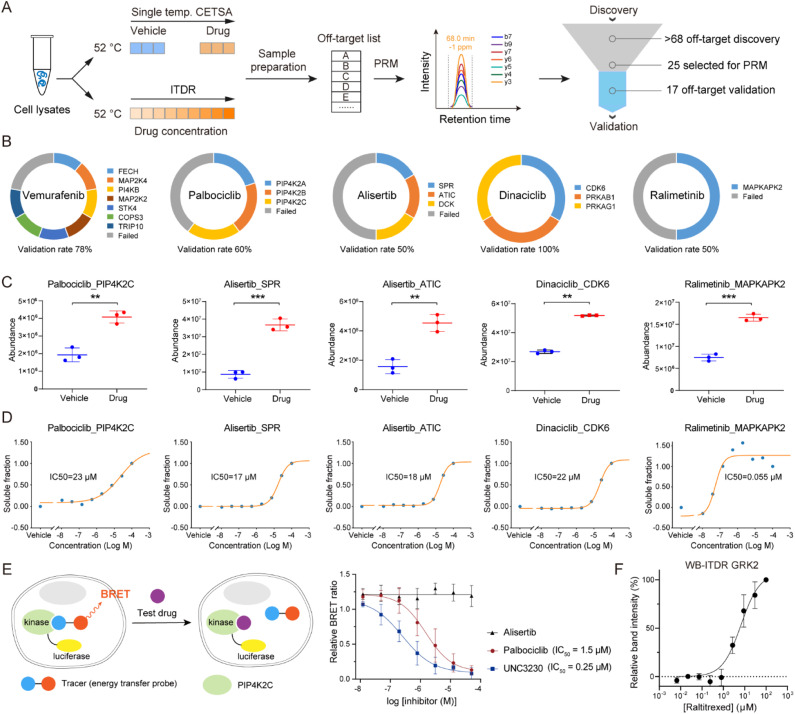
Drug development is plagued by inefficiency and high costs due to issues such as inadequate drug efficacy and unexpected toxicity. Mass spectrometry (MS)-based proteomics, particularly isobaric quantitative proteomics, offers a solution to unveil resistance mechanisms and unforeseen side effects related to off-targeting pathways. Thermal proteome profiling (TPP) has gained popularity for drug target identification at the proteome scale. However, it involves experiments with multiple temperature points, resulting in numerous samples and considerable variability in large-scale TPP analysis. We propose a high-throughput drug target discovery workflow that integrates single-temperature TPP, a fully automated proteomics sample preparation platform (autoSISPROT), and data independent acquisition (DIA) quantification. The autoSISPROT platform enables the simultaneous processing of 96 samples in less than 2.5 hours, achieving protein digestion, desalting, and optional TMT labeling (requires an additional 1 hour) with 96-channel all-in-tip operations. The results demonstrated excellent sample preparation performance with >94% digestion efficiency, >98% TMT labeling efficiency, and >0.9 intra- and inter-batch Pearson correlation coefficients. By automatically processing 87 samples, we identified both known targets and potential off-targets of 20 kinase inhibitors, affording over a 10-fold improvement in throughput compared to classical TPP. This fully automated workflow offers a high-throughput solution for proteomics sample preparation and drug target/off-target identification.


Conflict of interest statement

R. T. is a founder of BayOmics, Inc. The other authors declare no competing interests.

Figures

Fig. 1
Fig. 1. A fully automated and integrated 96-channel proteomics sample preparation platform (autoSISPROT) for high-throughput drug target discovery. (A) The workflows of high-throughput drug targets and off-targets identification by classical thermal proteome profiling (TPP) and our diaCETSA method that combines single temperature CETSA, autoSISPROT and DIA-based protein quantification. (B) The workflow of autoSISPROT. Protein samples in a 96-well plate are processed using the AssayMAP Bravo workstation, which is equipped with 96-well syringes and SISPROT-based cartridges. All the necessary sample preparation steps, including sample loading, protein reduction, alkylation, digestion, TMT labeling, and desalting, are executed by the programed upward aspiration and downward dispensing of the required buffers through the packed cartridges. The autoSISPROT protocol enables the automatic processing of up to 96 protein samples simultaneously, resulting in peptide solutions within 2.5 hours.
Fig. 2
Fig. 2. Comparison of the TMT and DIA based CETSA (tmtCETSA and diaCETSA). (A) The workflows of tmtCETSA and diaCETSA. (B) Bar charts showing the number of total proteins, kinases, significant kinases, and significant non-kinases by using tmtCETSA and diaCETSA. (C) Pearson correlation coefficient of protein intensities between two replicates by using tmtCETSA and diaCETSA. (D) Volcano plot visualization of kinase targets from K562 cell lysates, performed at 52 °C using 20 μM staurosporine by using tmtCETSA and diaCETSA. Adjusted p-value = 0.05 is indicated by a solid horizontal line. (E) Venn diagram displaying the kinase targets identified by classical TPP, tmtCETSA and diaCETSA methods. (F) Pie chart displaying the ratio of significant non-kinases that interact with kinases. (G) Interaction map of significant non-kinases PDCD10, PXN (tmtCETSA, right panel) and REHB (diaCETSA, left panel) interacting with kinases, respectively.
Fig. 3
Fig. 3. Performance of autoSISPROT. (A) The number of identified protein groups and peptides using autoSISPROT and manual SISPROT under three technical replicates. (B) Violin plots showing the distributions of CVs of protein LFQ intensities between autoSISPROT and manual SISPROT under three technical replicates. (C) Correlation of LFQ intensities of quantified proteins under three technical replicates. (D) Schematic representation of the experimental design. 96-well plates with 10 μg of HEK 293T cell lysates are processed in three batches on three different days. From each batch, ten randomly selected samples are subjected to LC-MS/MS analysis. (E) Protein groups and percentage of PSMs with zero missed cleavages across the three batches. (F) LFQ intensities of four proteins representing the different dynamic ranges are plotted across the three batches. (G) Pearson correlation coefficient of protein LFQ intensities for inter-batch comparison, and the displayed data are filtered for 75% data completeness. The inset graph shows a high correlation (>0.99) between replicate 5 and replicate 6 of batch 1. (H) The workflow for autoSISPROT that integrated TMT labeling. (I) Protein groups and peptide identifications across analytical duplicates. (J) TMT labeling efficiency was evaluated using the proportions of fully labeled, partial, and unlabeled PSMs. (K) Overlabeling efficiency was evaluated using the proportions of serine, threonine, tyrosine and histidine labeled PSMs.
Fig. 4
Fig. 4. High-throughput drug target identification for kinase inhibitors by combining autoSISPROT and diaCETSA. (A) Workflow for high-throughput identification of targets of kinase inhibitors. Dot plot visualization of target identification of OTS964, palbociclib, ralimetinib, SCIO-469, vemurafenib, alisertib, CHIR-98014, Chk2 Inhibitor II, dinaciclib, GSK180736A, MK-2206, and rabusertib. (B) Kinome tree displaying all identified kinase targets. (C) Venn diagram displaying the common and complementary targets of palbociclib and dinaciclib identified by kinobeads, classical TPP, and our method. The proteins marked in red are the known targets. (D) High-throughput off-target discovery by our method. All identified off-targets of alisertib, CHIR-98014, Chk2 Inhibitor II, dinaciclib, palbociclib, ralimetinib, rabusertib, SCIO-469, and vemurafenib, as well as the top 10 significant off-targets of GSK180736A and OTS964, are shown.
Fig. 5
Fig. 5. TPP analysis of the drug targets of SGC-GAK-1. (A) The workflow of TMT-based TPP with ten temperature points using autoSISPROT. (B and E) Scatter plot showing the correlation of Tm between two independent replicates for (B) MTX and (E) SGC-GAK-1. (C and F) Melting curves of DHFR in the presence (orange symbols) and absence (blue symbols) of (C) MTX and (F) SGC-GAK-1. Data are representative of two independent experiments. (D and G) Results of drug target identification for (D) MTX and (G) SGC-GAK-1. Proteins are ranked based on their scores generated using ProSAP software. The inset graph shows the scatter plot of ΔTm shifts calculated from the two independent replicates.
Fig. 6
Fig. 6. Off-target validation by PRM assay. (A) Workflow for the validation of off-targets via PRM assay that performed in single temperature TPP and ITDR modes. (B) Ring chart displaying the percentages of off-target validation for vemurafenib, palbociclib, alisertib, dinaciclib, and ralimetinib. (C and D) PRM-MS quantification of the selected potential off-targets. (C) K562 cell lysates were treated with a 20 μM drug or vehicle, followed by thermal treatment at 52 °C. (D) ITDR with treatment of eight concentrations (100, 27, 7.3, 2.0, 0.53, 0.14, 0.039, and 0.010 μM) of drug and vehicle, followed by thermal treatment at 52 °C. (E) NanoBRET analysis of palbociclib-PIP4K2C interaction in HEK 293T cells. A known inhibitor (UNC3230) of PIP4K2C was used as the positive control, and alisertib was taken as the negative control. n = 4 biologically independent replicates. (F) Western blot based ITDR for GRK2 at 52 °C. The band intensities were related to the intensities of the DMSO vehicle control samples. GAPDH levels were used to normalize the intensities. Data are reported as mean ± SD of three independent experiments.

References

    1. Scannell J. W. Bosley J. Hickman J. A. Dawson G. R. Truebel H. Ferreira G. S. Richards D. Treherne J. M. Nat. Rev. Drug Discovery. 2022;21:915–931. doi: 10.1038/s41573-022-00552-x. - DOI - PubMed
    1. Meissner F. Geddes-McAlister J. Mann M. Bantscheff M. Nat. Rev. Drug Discovery. 2022;21:637–654. doi: 10.1038/s41573-022-00409-3. - DOI - PubMed
    1. Savitski M. M. Reinhard F. B. Franken H. Werner T. Savitski M. F. Eberhard D. Martinez Molina D. Jafari R. Dovega R. B. Klaeger S. Kuster B. Nordlund P. Bantscheff M. Drewes G. Science. 2014;346:1255784. doi: 10.1126/science.1255784. - DOI - PubMed
    1. Zecha J. Bayer F. P. Wiechmann S. Woortman J. Berner N. Müller J. Schneider A. Kramer K. Abril-Gil M. Hopf T. Reichart L. Chen L. Hansen F. M. Lechner S. Samaras P. Eckert S. Lautenbacher L. Reinecke M. Hamood F. Prokofeva P. Vornholz L. Falcomatà C. Dorsch M. Schröder A. Venhuizen A. Wilhelm S. Médard G. Stoehr G. Ruland J. Grüner B. M. Saur D. Buchner M. Ruprecht B. Hahne H. The M. Wilhelm M. Kuster B. Science. 2023;380:93–101. doi: 10.1126/science.ade3925. - DOI - PMC - PubMed
    1. Mitchell D. C. Kuljanin M. Li J. Van Vranken J. G. Bulloch N. Schweppe D. K. Huttlin E. L. Gygi S. P. Nat. Biotechnol. 2023;41:845–857. doi: 10.1038/s41587-022-01539-0. - DOI - PMC - PubMed