Review
. 2023 Dec 7;4(1):3-24.
doi: 10.1021/acsmeasuresciau.3c00052. eCollection 2024 Feb 21.

Nanoscale Luminescence Imaging/Detection of Single Particles: State-of-the-Art and Future Prospects

Affiliations
Review

Nanoscale Luminescence Imaging/Detection of Single Particles: State-of-the-Art and Future Prospects

Muhammad Saqib et al. ACS Meas Sci Au. .

Abstract

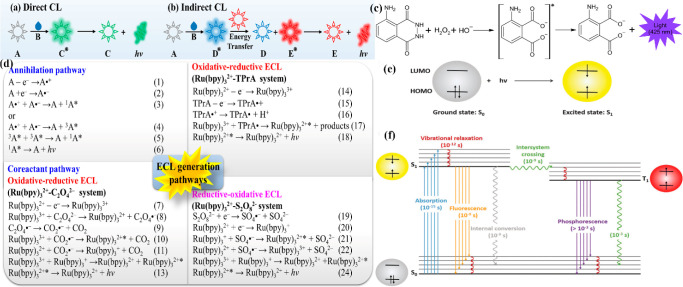
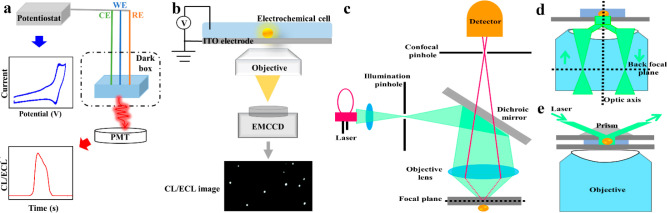
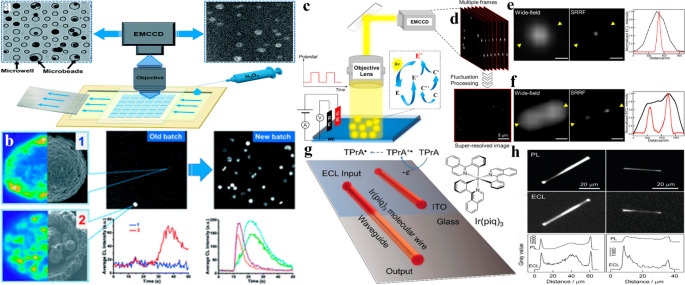
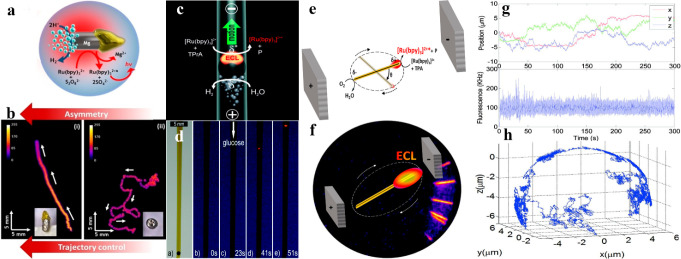
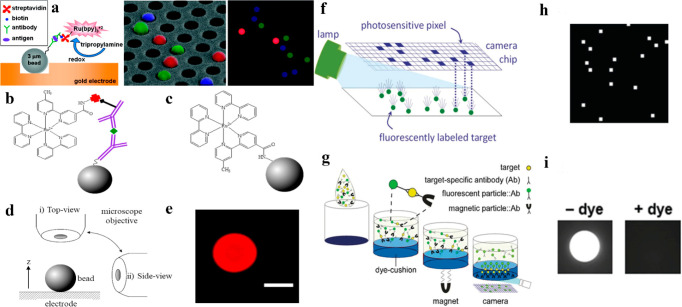
Single-particle-level measurements, during the reaction, avoid averaging effects that are inherent limitations of conventional ensemble strategies. It allows revealing structure-activity relationships beyond averaged properties by considering crucial particle-selective descriptors including structure/morphology dynamics, intrinsic heterogeneity, and dynamic fluctuations in reactivity (kinetics, mechanisms). In recent years, numerous luminescence (optical) techniques such as chemiluminescence (CL), electrochemiluminescence (ECL), and fluorescence (FL) microscopies have been emerging as dominant tools to achieve such measurements, owing to their diversified spectroscopy principles, noninvasive nature, higher sensitivity, and sufficient spatiotemporal resolution. Correspondingly, state-of-the-art methodologies and tools are being used for probing (real-time, operando, in situ) diverse applications of single particles in sensing, medicine, and catalysis. Herein, we provide a concise and comprehensive perspective on luminescence-based detection and imaging of single particles by putting special emphasis on their basic principles, mechanistic pathways, advances, challenges, and key applications. This Perspective focuses on the development of emission intensities and imaging based individual particle detection. Moreover, several key examples in the areas of sensing, motion, catalysis, energy, materials, and emerging trends in related areas are documented. We finally conclude with the opportunities and remaining challenges to stimulate further developments in this field.


Conflict of interest statement

The authors declare no competing financial interest.

Figures

Figure 1
Figure 1
Schematic representation of direct (a) and indirect (b) CL. Asterisk (*) indicates the excited product. (c) Schematic showing the CL generation mechanism of a classical luminol-H2O2 system with a blue emission at 425 nm. (d) Schematic showing typical examples of annihilation and coreactant pathways for ECL generation. Asterisk (*) indicates the excited product. (e) Schematic illustration of the molecular orbital for demonstrating the general principle of PL. (f) Jablonski diagram displaying the typical photophysical processes in molecule. Reprinted from ref (61) with permission from the Royal Society of Chemistry, copyright 2019.
Figure 2
Figure 2
(a) Schematic of the typical CL and ECL light intensity (setup) based detections and (b) CL and ECL microscopy-based detection/imaging setup for single particle detection. Note: CL based detection/imaging does not require an electrochemical workstation (potentiostat). Schematic drawing of confocal microscopy setup (c), objective-type TIRFM setup (d), and prism-type TIRFM setup (e).
Figure 3
Figure 3
(a) CL-based imaging setup designed for detecting and imaging single microbeads. (b) Representative CL kinetic curves (left panels) and averaged CL images (right panels) from the old and new batches of microbeads during reaction with H2O2, respectively. Reprinted from ref (26) with permission from the Royal Society of Chemistry, copyright 2019. (c) Schematic showing the single particle imaging with ECL microscopy setup. E symbolizes the luminophore (Ru(bpy)32+), while C represents the coreactant (TPrA). (d) SRRF analysis (basic principle) of multiple frames (images). (e, f) Wide-field ECL images (left panels), super-resolution ECL images (middle panels), and corresponding line profiles (drawn from the areas/regions between yellow-colored arrowhead) of an individual Au nanosphere and separated Au nanospheres, respectively). Scale bar: 500 nm. Reprinted from ref (80) from American Chemical Society, copyright 2021. (g) Schematic drawing showing the ECL waveguide in an individual crystalline molecular wire of Ir(piq)3 on an electrode surface (patterned ITO). (h) Representative PL (top), ECL (middle) images, and corresponding grayscale variations of two molecular wires along the longitudinal axis. Reprinted from ref (83) with permission from Wiley-VCH, copyright 2020.
Figure 4
Figure 4
(a) Schematic displaying the motion and CL generation principles of an autonomous chemiluminescent Janus microswimmer. (b) Tracks imaging reveals the maximum CL emission of an anisotropic CL particle modified with a polymer (i) and unmodified isotropic particle (ii) moving at a solution surface. The solution was prepared by mixing H2SO4 (20 mM), K2S2O8 (20 mM), and Ru(bpy)3(PF6)2 (1 mM) in H2O/ACN (1/1). Global time: 90 s (every experiment). Adapted from ref (81) with permission from the Royal Society of Chemistry, copyright 2020. (c) Asymmetric redox activity on the surface of a bipolar swimmer induced its simultaneous motion and ECL emission in a glass tube. Reprinted from ref (100) with permission from Wiley-VCH, copyright 2012. (d) Images displaying dynamic glucose detection, wherein ECL was switched on during the swimmer motion (toward top of the capillary) in a vertical glucose concentration gradient. Reprinted from ref (101) with permission from the Royal Society of Chemistry, copyright 2014. (e, f) Image displaying ECL tracking (spatial distribution) of a magnetic rotating BPE. Reprinted from ref (82) with permission from American Chemical Society, copyright 2019. (g) 3D tracking (x, y, z positions; top panel) of a PS particle (diameter ∼ 200 nm) and corresponding FL intensity while diffusing at a silicone oil droplet (surface) in water. (h) 3D trajectory displaying the oil droplet profile. Reprinted from ref (105) from American Chemical Society, copyright 2012.
Figure 5
Figure 5
Single NP collisions generated discrete ECL signals: (a) “spike” and (b) “staircase.” Inset: ECL images of a single NP during collision events. Exposure time: 0.2 s; scale bars: 2 μm; constant potential: 1.4 V. Reprinted from ref (85) with permission from the Royal Society of Chemistry, copyright 2018. (c) Schematic illustration of the experimental setup utilized for FL imaging of single Ag NP collision events inside a microfabricated nanocell (nanopipette) (left column). FL images represent the individual particle collision responses under different time periods (right column). Reprinted from ref (89) from American Chemical Society, copyright 2017. (d) A series of images showing the spatial distribution of ECL intensities on an individual Au nanoplate. Representative bright-field (a), ECL (b), and corresponding false-color overlay image (c). Enlarged version of red circled areas (d, g) of the ECL image (b). Divided regions of flat surface facet (blue), edges (green), and corners (red) in (e, h) ECL images. Matlab obtained ECL intensities with a 2D spatial distribution (f, i). ECL intensity gradients (j) for three recording lines shown in (i). Statistical and box charts illustrate site-specific ECL intensities. Reprinted from ref (46) with permission from the Royal Society of Chemistry, copyright 2019.
Figure 6
Figure 6
(a) Schematic showing the setup of ECL microscopy applied for monitoring HER at an individual NP level. Colocalization analysis of (b) ECL, (c) FL, and (d) SEM images of the same HCNSs sets. (e) ECL trajectory of a single HCNS during a constant (−1.5 V) negative potential. ECL OFF state (black stick marking) and ECL ON state (blue stick marking) were distinguished for statistical analysis by setting the threshold. (f) ECL trajectories of Pt-HCNS, NiS-HCNS, AuPd-HCNS, and pristine HCNS, at −1.5 V. K2SO4 (100 mM) solution containing K2S2O8 (100 mM) coreactant was used as electrolyte. ECL and FL imaging exposure time was 1 s. (g) Resulting polarization curves for the HER at 5 mV/s (scan rate) in the K2SO4 (100 mM) electrolyte. Reprinted from ref (84) from American Chemical Society, copyright 2020. (h) Scheme showing a nanocatalyst image in nanoconfinement that consist of PtNPs (5 nm) sandwiched between a mesoporous SiO2 shell (120 nm) and a solid SiO2 core (100 nm). The nonfluorescent (AR) reactant molecule was oxidized (catalytically) at the PtNPs active surface sites to produce fluorescent (resorufin) product molecule. Reprinted from ref (127) with permission from Springer Nature, copyright 2018. (i) Schematic revealing the 2e ORR at a single Fe3O4 NPs level. Reprinted from ref (128) from American Chemical Society, copyright 2020.
Figure 7
Figure 7
(a) Schematic showing the dual-mode imaging of a single nanoplate of the Co(OH)2 OER process using Vis-Absorption and ECL. ECL imaging (bottom part) achieved under applied voltage from 0.4 to 1.5 V. Reprinted from ref (130) from American Chemical Society, copyright 2023. (b) Oxygen vacancies spatial distribution tracking across varying facets of a single BiVO4 particle in an in situ manner. Reprinted from ref (131) from American Chemical Society, copyright 2023 . (c, d) PL images of single Cu2O microcrystals over different periods of time for revealing their corresponding heterogeneous photocorrosion activity. Reprinted from ref (132) from American Chemical Society, copyright 2022, .
Figure 8
Figure 8
(a) Schematic showing the photocatalytic oxidation and reduction reactions of AR and resazurin on an individual TiO2 particle, respectively. (b) Single-molecule FL images reveal the photocatalytic oxidation ① of AR and reduction ② of resazurin on a single TiO2 particle at various times. Inset in ①: Time trace of FL intensity recorded over the yellow-color circled area. Scale bar: 1 μm. Reprinted from ref (134) with permission from the US National Academy of Sciences, copyright 2019. (c) Scheme showing the conversion mechanism of nonfluorescent AR to FL resorufin. (d) TIRFM setup for single-molecule FLM. (e) SEM graphic presenting the TiO2 NRs onto an ITO surface. Wherein pink color spots symbolize single product molecules. (f, g) Images showing the photoelectrochemical current dynamics and surface reaction intermediates vs electrochemical applied potential. (h) Image plotting the rate constant potential dependence under light Off (black squares) and On (blue circles) intervals. Reprinted with permission from ref (92) with permission from the Electrochemical Society, copyright(2019.
Figure 9
Figure 9
(a) Schematic illustration of a sandwich immunoassay, wherein a bead-based platform was constructed to achieve the ECL detection of multiple antigens simultaneously in a microarray format. Reprinted from ref (141) from American Chemical Society, copyright 2009. (b) Schematic illustration of a sandwich bead-based immunoassay with an ECL readout. (c) Schematic showing the functionalization of a PS bead with an ECL label. (d) Schematic of the two different microscope objective configurations (i.e., top-view and side-view) utilized for imaging the labeled bead. (e) PL image (top view) of a ruthenium (homogeneously distributed) labeled PS bead via a sandwich immunoassay format. The scale bar was 10 μm. Reprinted from ref (142) with permission from Elsevier, copyright 2020. (f) Schematic illustration of the detection/imaging of individual fluorescent beads (bound with molecular targets) on the camera’s chip by capturing one or a small group of pixels without the requirement of magnified microscope. (g) After the formation of the immunocomplex, the magnetic beads were drawn toward the microwell bottom (through dye cushion) by applying a magnet and deposited on the imaging surface. Only fluorescent beads in proximity of the surface were excited due to the excitation light absorption (deep into the well). (h) Digital camera recording of fluorescent beads as bright pixels. (i) Images of wells displaying the comparison with and without dye for revealing the effectiveness of the dye-cushion layer. Reprinted from ref (95) with permission from the Springer Nature under a Creative Commons Attribution 4.0 International License.

Similar articles

Cited by

References

    1. Baker L. A. Perspective and Prospectus on Single-Entity Electrochemistry. J. Am. Chem. Soc. 2018, 140 (46), 15549–15559. 10.1021/jacs.8b09747. - DOI - PMC - PubMed
    1. Wang W. Imaging the chemical activity of single nanoparticles with optical microscopy. Chem. Soc. Rev. 2018, 47 (7), 2485–2508. 10.1039/C7CS00451F. - DOI - PubMed
    1. Yang H.; Saqib M.; Hao R. Single-Entity Detection With TEM-Fabricated Nanopores. Front Chem 2021, 9 (305), 66482010.3389/fchem.2021.664820. - DOI - PMC - PubMed
    1. Lai S. C.; Dudin P. V.; Macpherson J. V.; Unwin P. R. Visualizing zeptomole (electro)catalysis at single nanoparticles within an ensemble. J. Am. Chem. Soc. 2011, 133 (28), 10744–7. 10.1021/ja203955b. - DOI - PubMed
    1. Kim J.; Renault C.; Nioradze N.; Arroyo-Curras N.; Leonard K. C.; Bard A. J. Electrocatalytic Activity of Individual Pt Nanoparticles Studied by Nanoscale Scanning Electrochemical Microscopy. J. Am. Chem. Soc. 2016, 138 (27), 8560–8. 10.1021/jacs.6b03980. - DOI - PubMed

LinkOut - more resources