An exosome-derived lncRNA signature identified by machine learning associated with prognosis and biomarkers for immunotherapy in ovarian cancer
- PMID: 38404588
- PMCID: PMC10884316
- DOI: 10.3389/fimmu.2024.1228235
An exosome-derived lncRNA signature identified by machine learning associated with prognosis and biomarkers for immunotherapy in ovarian cancer
Abstract
Background: Ovarian cancer (OC) has the highest mortality rate among gynecological malignancies. Current treatment options are limited and ineffective, prompting the discovery of reliable biomarkers. Exosome lncRNAs, carrying genetic information, are promising new markers. Previous studies only focused on exosome-related genes and employed the Lasso algorithm to construct prediction models, which are not robust.
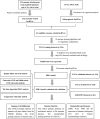
Methods: 420 OC patients from the TCGA datasets were divided into training and validation datasets. The GSE102037 dataset was used for external validation. LncRNAs associated with exosome-related genes were selected using Pearson analysis. Univariate COX regression analysis was used to filter prognosis-related lncRNAs. The overlapping lncRNAs were identified as candidate lncRNAs for machine learning. Based on 10 machine learning algorithms and 117 algorithm combinations, the optimal predictor combinations were selected according to the C index. The exosome-related LncRNA Signature (ERLS) model was constructed using multivariate COX regression. Based on the median risk score of the training datasets, the patients were divided into high- and low-risk groups. Kaplan-Meier survival analysis, the time-dependent ROC, immune cell infiltration, immunotherapy response, and immune checkpoints were analyzed.
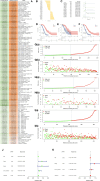
Results: 64 lncRNAs were subjected to a machine-learning process. Based on the stepCox (forward) combined Ridge algorithm, 20 lncRNA were selected to construct the ERLS model. Kaplan-Meier survival analysis showed that the high-risk group had a lower survival rate. The area under the curve (AUC) in predicting OS at 1, 3, and 5 years were 0.758, 0.816, and 0.827 in the entire TCGA cohort. xCell and ssGSEA analysis showed that the low-risk group had higher immune cell infiltration, which may contribute to the activation of cytolytic activity, inflammation promotion, and T-cell co-stimulation pathways. The low-risk group had higher expression levels of PDL1, CTLA4, and higher TMB. The ERLS model can predict response to anti-PD1 and anti-CTLA4 therapy. Patients with low expression of PDL1 or high expression of CTLA4 and low ERLS exhibited significantly better survival prospects, whereas patients with high ERLS and low levels of PDL1 or CTLA4 exhibited the poorest outcomes.
Conclusion: Our study constructed an ERLS model that can predict prognostic risk and immunotherapy response, optimizing clinical management for OC patients.
Keywords: exosome-related lncRNA; immunotherapy response; machine learning; ovarian cancer; prognosis model.
Copyright © 2024 Cui, Zhang, Lu, Feng, Wu, Zhuo, Zhang and Zhang.
Conflict of interest statement
The authors declare that the research was conducted in the absence of any commercial or financial relationships that could be construed as a potential conflict of interest.
Figures


Similar articles
-
Computational construction of TME-related lncRNAs signature for predicting prognosis and immunotherapy response in clear cell renal cell carcinoma.J Clin Lab Anal. 2022 Aug;36(8):e24582. doi: 10.1002/jcla.24582. Epub 2022 Jul 8. J Clin Lab Anal. 2022. PMID: 35808868 Free PMC article.
-
A prognostic model based on immune-related long noncoding RNAs for patients with epithelial ovarian cancer.J Ovarian Res. 2022 Jan 15;15(1):8. doi: 10.1186/s13048-021-00930-w. J Ovarian Res. 2022. PMID: 35031063 Free PMC article.
-
Exosome-related lncRNA score: A value-based individual treatment strategy for predicting the response to immunotherapy in clear cell renal cell carcinoma.Cancer Med. 2024 Jun;13(11):e7308. doi: 10.1002/cam4.7308. Cancer Med. 2024. PMID: 38808948 Free PMC article.
-
Unlocking the predictive potential of long non-coding RNAs: a machine learning approach for precise cancer patient prognosis.Ann Med. 2023;55(2):2279748. doi: 10.1080/07853890.2023.2279748. Epub 2023 Nov 20. Ann Med. 2023. PMID: 37983519 Free PMC article. Review.
-
Exosomes in Ovarian Cancer: Towards Precision Oncology.Pharmaceuticals (Basel). 2025 Mar 5;18(3):371. doi: 10.3390/ph18030371. Pharmaceuticals (Basel). 2025. PMID: 40143147 Free PMC article. Review.
Cited by
-
Integrative multi-omics and machine learning approach reveals tumor microenvironment-associated prognostic biomarkers in ovarian cancer.Transl Cancer Res. 2024 Nov 30;13(11):6182-6200. doi: 10.21037/tcr-24-539. Epub 2024 Nov 7. Transl Cancer Res. 2024. PMID: 39697754 Free PMC article.
-
MiRNA-Based Exosome-Targeted Multi-Target, A Multi-Pathway Intervention for Personalized Lung Cancer Therapy: Prognostic Prediction and Survival Risk Assessment.Iran J Biotechnol. 2025 Apr 1;23(2):e4112. doi: 10.30498/ijb.2025.516588.4112. eCollection 2025 Apr. Iran J Biotechnol. 2025. PMID: 40860049 Free PMC article.
-
Machine learning-based identification of exosome-related biomarkers and drugs prediction in nasopharyngeal carcinoma.Discov Oncol. 2025 Jun 17;16(1):1134. doi: 10.1007/s12672-025-02962-w. Discov Oncol. 2025. PMID: 40526256 Free PMC article.
-
Machine learning-based integration develops relapse related signature for predicting prognosis and indicating immune microenvironment infiltration in breast cancer.Sci Rep. 2025 Jun 5;15(1):19773. doi: 10.1038/s41598-025-03423-8. Sci Rep. 2025. PMID: 40473720 Free PMC article.
-
A novel prognostic model based on migrasome-related LncRNAs for gastric cancer.Sci Rep. 2025 Apr 25;15(1):14572. doi: 10.1038/s41598-025-99781-4. Sci Rep. 2025. PMID: 40281132 Free PMC article.
References
-
- Hamanishi J, Takeshima N, Katsumata N, Ushijima K, Kimura T, Takeuchi S, et al. . Nivolumab versus gemcitabine or pegylated liposomal doxorubicin for patients with platinum-resistant ovarian cancer: open-label, randomized trial in Japan (NINJA). J Clin Oncol (2021) 39:3671–81. doi: 10.1200/JCO.21.00334 - DOI - PMC - PubMed
Publication types
MeSH terms
Substances
LinkOut - more resources
Full Text Sources
Medical
Research Materials

