

Salinity-induced succession of phototrophic communities in a southwestern Siberian soda lake during the solar activity cycle
- PMID: 38404883
- PMCID: PMC10884861
- DOI: 10.1016/j.heliyon.2024.e26120
Salinity-induced succession of phototrophic communities in a southwestern Siberian soda lake during the solar activity cycle
Abstract
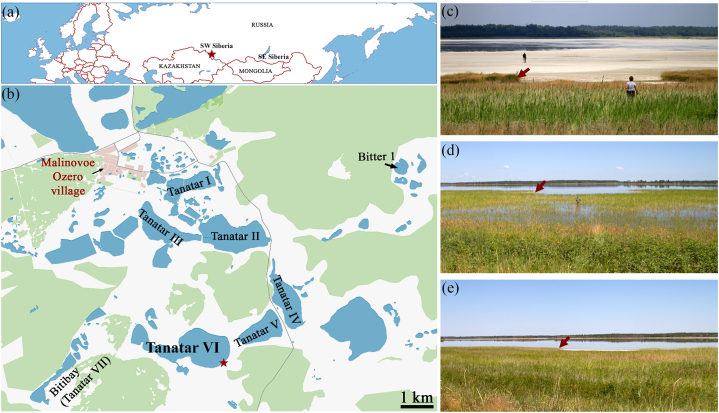
A variety of lakes located in the dry steppe area of southwestern Siberia are exposed to rapid climatic changes, including intra-century cycles with alternating dry and wet phases driven by solar activity. As a result, the salt lakes of that region experience significant fluctuations in water level and salinity, which have an essential impact on the indigenous microbial communities. But there are few microbiological studies that have analyzed this impact, despite its importance for understanding the functioning of regional water ecosystems. This work is a retrospective study aimed at analyzing how solar activity-related changes in hydrological regime affect phototrophic microbial communities using the example of the shallow soda lake Tanatar VI, located in the Kulunda steppe (Altai Region, Russia, southwestern Siberia). The main approach used in this study was the comparison of hydrochemical and microscopic data obtained during annual field work with satellite and solar activity data for the 12-year observation period (2011-2022). The occurrence of 33 morphotypes of cyanobacteria, two key morphotypes of chlorophytes, and four morphotypes of anoxygenic phototrophic bacteria was analyzed due to their easily recognizable morphology. During the study period, the lake surface changed threefold and the salinity changed by more than an order of magnitude, which strongly correlated with the phases of the solar activity cycles. The periods of high (2011-2014; 100-250 g/L), medium (2015-2016; 60 g/L), extremely low (2017-2020; 13-16 g/L), and low (2021-2022; 23-34 g/L) salinity with unique biodiversity of phototrophic communities were distinguished. This study shows that solar activity cycles determine the dynamics of the total salinity of a southwestern Siberian soda lake, which in turn determines the communities and microorganisms that will occur in the lake, ultimately leading to cyclical changes in alternative states of the ecosystem (dynamic stability).
Keywords: Diversity; Dynamic stability; Phototrophs; Salinity; Soda lakes; Solar activity.
© 2024 Published by Elsevier Ltd.
Conflict of interest statement
The authors declare that they have no known competing financial interests or personal relationships that could have appeared to influence the work reported in this paper.
Figures


Similar articles
-
Effect of salinity on diazotrophic activity and microbial composition of phototrophic communities from Bitter-1 soda lake (Kulunda Steppe, Russia).Extremophiles. 2018 Jul;22(4):651-663. doi: 10.1007/s00792-018-1026-7. Epub 2018 Apr 16. Extremophiles. 2018. PMID: 29663079
-
The patterns of nitrogen fixation in haloalkaliphilic phototrophic communities of Kulunda Steppe soda lakes (Altai, Russia).FEMS Microbiol Ecol. 2019 Nov 1;95(11):fiz174. doi: 10.1093/femsec/fiz174. FEMS Microbiol Ecol. 2019. PMID: 31712814
-
Methanogenesis at extremely haloalkaline conditions in the soda lakes of Kulunda Steppe (Altai, Russia).FEMS Microbiol Ecol. 2015 Apr;91(4):fiv016. doi: 10.1093/femsec/fiv016. Epub 2015 Feb 11. FEMS Microbiol Ecol. 2015. PMID: 25764464
-
Microbiology of Lonar Lake and other soda lakes.ISME J. 2013 Mar;7(3):468-76. doi: 10.1038/ismej.2012.137. Epub 2012 Nov 22. ISME J. 2013. PMID: 23178675 Free PMC article. Review.
-
Functional microbiology of soda lakes.Curr Opin Microbiol. 2015 Jun;25:88-96. doi: 10.1016/j.mib.2015.05.004. Epub 2015 May 27. Curr Opin Microbiol. 2015. PMID: 26025021 Review.
Cited by
-
Draft genome sequence of Methanocalculus natronophilus sp. strain Z-7105T, an alkaliphilic, methanogenic archaeon isolated from a soda lake.Microbiol Resour Announc. 2024 Jul 18;13(7):e0035024. doi: 10.1128/mra.00350-24. Epub 2024 Jun 4. Microbiol Resour Announc. 2024. PMID: 38832796 Free PMC article.
-
Strain-Specific Features of Primary Metabolome Characteristic for Extremotolerant/Extremophilic Cyanobacteria Under Long-Term Storage.Int J Mol Sci. 2025 Feb 28;26(5):2201. doi: 10.3390/ijms26052201. Int J Mol Sci. 2025. PMID: 40076823 Free PMC article.
References
-
- Lebedeva(Verba M.P., Lopukhina O.V., Kalinina N.V. Specificity of the chemical and mineralogical composition of salts in solonchak playas and lakes of the Kulunda steppe. Eurasian Soil Sci. 2008;41(4):416–428. doi: 10.1134/S106422930804008X. - DOI
-
- Telentyuk E.S. Hydrochemistry of Tanatar lakes and their feeding waters. Trudy Vsesoyuznogo NII galurgii. 1952;24:162–228. In Russian.
-
- Shnitnikov A.V. Intra-century fluctuations in the level of steppe lakes in Western Siberia and Northern Kazakhstan and its dependence on climate. Proc. Lab. Lake Sci. AS USSR. 1950;1:129. In Russian.
-
- Shnitnikov A.V. In: Intra-century Variability of Total Humidity Components/ Kalesnik S.V., editor. Nauka.; Leningrad: 1969. p. 244. In Russian.
-
- Maksimov A.A. In: Natural Cycles. Reasons for the Recurrence of Ecological Processes/ Kolomiets N.G., editor. Nauka.; Leningrad: 1989. p. 236. с., In Russian.
LinkOut - more resources
Full Text Sources
Research Materials
