. 2024 Feb 23;22(2):e8589.
doi: 10.2903/j.efsa.2024.8589. eCollection 2024 Feb.

Antimicrobial consumption and resistance in bacteria from humans and food-producing animals: Fourth joint inter-agency report on integrated analysis of antimicrobial agent consumption and occurrence of antimicrobial resistance in bacteria from humans and food-producing animals in the EU/EEA JIACRA IV - 2019-2021

Antimicrobial consumption and resistance in bacteria from humans and food-producing animals: Fourth joint inter-agency report on integrated analysis of antimicrobial agent consumption and occurrence of antimicrobial resistance in bacteria from humans and food-producing animals in the EU/EEA JIACRA IV - 2019-2021

European Centre for Disease Prevention and Control (ECDC) et al. EFSA J. .

Abstract

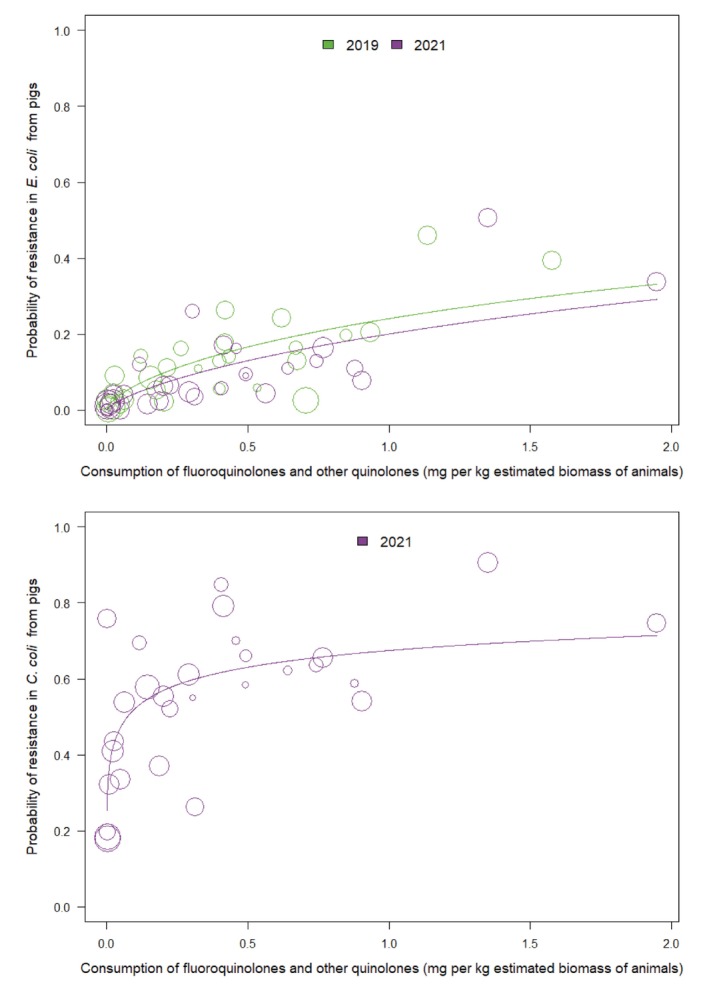
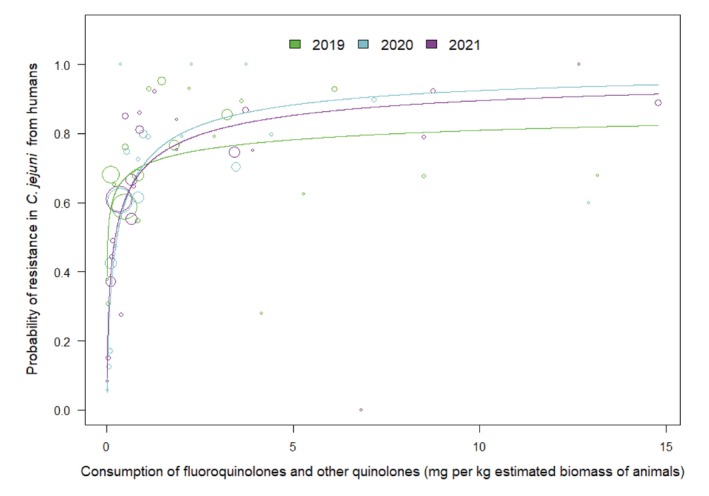
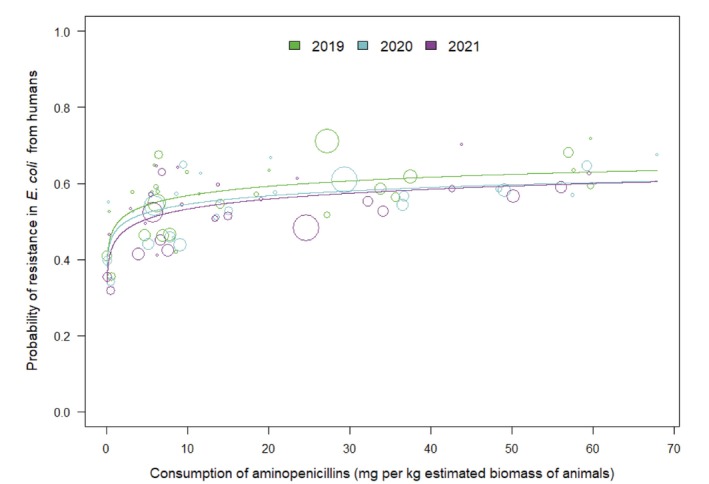
The fourth joint inter-agency report on integrated analysis of antimicrobial consumption (AMC) and the occurrence of antimicrobial resistance (AMR) in bacteria from humans and food-producing animals (JIACRA) addressed data obtained by the Agencies' EU-wide surveillance networks for 2019-2021. The analysis also sought to identify whether significant trends in AMR and AMC were concomitant over 2014-2021. AMC in both human and animal sectors, expressed in mg/kg of estimated biomass, was compared at country and European level. In 2021, the total AMC was assessed at 125.0 mg/kg of biomass for humans (28 EU/EEA countries, range 44.3-160.1) and 92.6 mg/kg of biomass for food-producing animals (29 EU/EEA countries, range 2.5-296.5). Between 2014 and 2021, total AMC in food-producing animals decreased by 44%, while in humans, it remained relatively stable. Univariate and multivariate analyses were performed to study associations between AMC and AMR for selected combinations of bacteria and antimicrobials. Positive associations between consumption of certain antimicrobials and resistance to those substances in bacteria from both humans and food-producing animals were observed. For certain combinations of bacteria and antimicrobials, AMR in bacteria from humans was associated with AMR in bacteria from food-producing animals which, in turn, was related to AMC in animals. The relative strength of these associations differed markedly between antimicrobial class, microorganism and sector. For certain antimicrobials, statistically significant decreasing trends in AMC and AMR were concomitant for food-producing animals and humans in several countries over 2014-2021. Similarly, a proportion of countries that significantly reduced total AMC also registered increasing susceptibility to antimicrobials in indicator E. coli from food-producing animals and E. coli originating from human invasive infections (i.e., exhibited 'complete susceptibility' or 'zero resistance' to a harmonised set of antimicrobials). Overall, the findings suggest that measures implemented to reduce AMC in food-producing animals and in humans have been effective in many countries. Nevertheless, these measures need to be reinforced so that reductions in AMC are retained and further continued, where necessary. This also highlights the importance of measures that promote human and animal health, such as vaccination and better hygiene, thereby reducing the need for use of antimicrobials.

Keywords: antimicrobial consumption; antimicrobial resistance; comparative trend analysis; ecological analysis; food‐producing animals; logistic regression; partial least square path modelling; public health.


Conflict of interest statement

If you wish to access the declaration of interests of any expert contributing to an EFSA scientific assessment, please contact interestmanagement@efsa.europa.eu.

Figures

FIGURE I
FIGURE I
Schematic overview of the potential associations between antimicrobial consumption and antimicrobial resistance in humans and food‐producing animals investigated in this report.
FIGURE II
FIGURE II
Population‐weighted mean of the total consumption of antimicrobials in humansa and food‐producing animalsb in 26 EU/EEA countriesc for which data were available both for humans and food‐producing animals, mg per kg of estimated biomass, 2014–2021. aAntibacterials for systemic use (ATC group J01). bFor antimicrobial groups included in overall consumption data (ATC and ATCvet codes), please refer to Section 3.2. cAT, BE, BG, CY, DE, DK, EE, ES, FI, FR, HR, HU, IE, IS, IT, LT, LU, LV, NL, NO, PL, PT, RO, SE, SI, SK. The levels of consumption should be compared with caution between humans and animals, as the calculation of the denominator differs. For details see text box under Figure 8. In the box plots, the lowest boundary indicates the 25th percentile, the black horizontal line within the box marks the median and the upper boundary of the box indicates the 75th percentile. The vertical extending lines denote the most extreme values within 1.5 interquartile range of the 25th and 75th percentile of each group. Only outlying observations (outside of this range) are represented as dots.
FIGURE III
FIGURE III
Schematic overview of the associations between antimicrobial consumption and antimicrobial resistance in humans and food‐producing animals investigated and identified as a result of the analyses performed for this report.
FIGURE 1
FIGURE 1
Schematic overview of the potential associations between antimicrobial consumption and antimicrobial resistance in humans and food‐producing animals investigated in this report.
FIGURE 2
FIGURE 2
Comparison of clinical breakpoints for I – ‘susceptible, increased exposure’ and R –‘resistant’ categories combined and epidemiological cut‐off values used to interpret MIC data reported for Escherichia coli from humans and food‐producing animals, 2021 breakpoint data.
FIGURE 3
FIGURE 3
Comparison of clinical breakpoints for I – ‘susceptible, increased exposure’ and R – ‘resistant’ categories combined and epidemiological cut‐off values used to interpret MIC data reported for Salmonella from humans and food‐producing animals.
FIGURE 4
FIGURE 4
Comparison of clinical breakpoints for I – ‘susceptible, increased exposure’ and R – ‘resistant’ categories combined and epidemiological cut‐off values used to interpret MIC data reported for Campylobacter spp. from humans and food‐producing animals.
FIGURE 5
FIGURE 5
Diagram showing the initial model considered to assess the potential relationships between resistance in bacteria from humans (AMRhuman) and antimicrobial consumption in humans (AMChuman), antimicrobial consumption in food‐producing animals (AMCanimal) (whether as direct or indirect influential factor), and resistance in bacteria in food‐producing animals (AMRanimal). Although AMR data used in this report covered cattle under 1 year of age, sales for the same animal population could not be estimated with the approach used – cattle in general is typically given as the target species in the product information. Consequently, cattle under 1 year of age could not be addressed in the multivariate analysis.
FIGURE 6
FIGURE 6
Comparison of population biomass‐corrected consumption of antimicrobialsa (milligrams per kilogram estimated biomass) in humans and food‐producing animals by country, in 29 EU/EEA countries for which data were available both for humans and food‐producing animals, 2021. An asterisk (*) denotes that only community consumption was provided for human medicine. The weighted mean represents the population‐weighted mean of data from included countries providing total consumption (community and hospital sectors combined). Note: The estimates presented are crude and must be interpreted with caution. For limitations hampering comparison of antimicrobial consumption in humans and food‐producing animals, see Section 15.12. aFor antimicrobial groups included in overall consumption data (ATC and ATCvet codes), please refer to Section 3.2.
FIGURE 7
FIGURE 7
Comparison of consumption of antimicrobial groupsa in humans and food‐producing animals, in 29 EU/EEA countries for which data were available both for humansb and food‐producing animals, 2021. aFor antimicrobial groups included (ATC and ATCvet codes), please refer to Section 3.2. bGermany's antimicrobial consumption data are for the community sector only, as hospital sector data were not reported. cAminopenicillins are shown in dark colour and all other penicillins in light colour. dFluoroquinolones are shown in dark colour and other quinolones in light colour. 1The figure on the right hand side is presented on a different scale to better illustrate the data of substances with a limited use. 2The estimates presented are crude and must be interpreted with caution. For limitations hampering comparison of antimicrobial consumption by humans and food‐producing animals, see Section 15.12.
FIGURE 8
FIGURE 8
Population‐weighted mean of the total consumption of antimicrobials in humansa and food‐producing animalsb in 26 EU/EEA countriesc for which data were available both for humans and food‐producing animals, mg per kg of estimated biomass, 2014–2021. aAntibacterials for systemic use (ATC group J01). bFor antimicrobial groups included in overall consumption data (ATC and ATCvet codes), please refer to Section 3.2. cAT, BE, BG, CY, DE, DK, EE, ES, FI, FR, HR, HU, IE, IS, IT, LT, LU, LV, NL, NO, PL, PT, RO, SE, SI, SK. The levels of consumption should be compared with caution between humans and animals, as the calculation of the denominator differs. For details see text box under Figure 8. In the box plots, the lowest boundary indicates the 25th percentile, the black horizontal line within the box marks the median and the upper boundary of the box indicates the 75th percentile. The vertical extending lines denote the most extreme values within 1.5 interquartile range of the 25th and 75th percentile of each group. Only outlying observations (outside of this range) are represented as dots.
FIGURE 9
FIGURE 9
Consumption of carbapenems in humans expressed as DDD per 1000 inhabitants and per day, by country, EU/EEA, 2021. *For Germany, only community consumption was provided for human medicine. Germany's human consumption data were therefore not included in the weighted mean, as only countries providing total consumption (community and hospital sectors combined) were considered for the population‐weighted mean consumption value. aFor antimicrobial agents included (ATC codes), please refer to Section 3.2.
FIGURE 10
FIGURE 10
Trend graph of consumption of carbapenemsa for humans in EU/EEA countriesb, defined daily doses per 1000 inhabitants, 2014–2021. aFor antimicrobial groups included in overall consumption data (ATC codes), please refer to Section 3.2. bThe countries involved in the analysis may slightly vary between years; consequently, a trend line was not generated, and the specific country names are not listed in this context. Carbapenems are not authorised in veterinary medicine and, in the absence of evaluation for maximum residue limits (MRLs), cannot be used for food‐producing animals. The use of these antimicrobials in food‐producing animals is prohibited since 2022. Therefore, this graph only displays AMC data in humans. In the box plots, the lowest boundary indicates the 25th percentile, the black horizontal line within the box marks the median and the upper boundary of the box indicates the 75th percentile. The vertical extending lines denote the most extreme values within 1.5 interquartile range of the 25th and 75th percentile of each group. Only outlying observations (outside of this range) are represented as dots.
FIGURE 11
FIGURE 11
Consumption of carbapenems in humans and the probability of resistance to carbapenems in invasive Klebsiella pneumoniae from humans, EU/EEA, 2019–2021 (see Table 12). The figure displays results of logistic regression analyses. Bubbles represent the countries included in the analysis. The size of the bubbles indicates the amount of available resistance data per country.
FIGURE 12
FIGURE 12
Consumption of carbapenems in humans and the probability of resistance to carbapenems in invasive Escherichia coli from humans, EU/EEA, 2019–2021 (see Table 13). The figure displays results of logistic regression analyses. Bubbles represent the countries included in the analysis. The size of the bubbles indicates the amount of available resistance data per country.
FIGURE 13
FIGURE 13
Comparison of annual changes in consumption of carbapenems in humans and in resistance to carbapenems in Escherichia coli from humans between 2014 and 2021 by EU/EEA country. White zone, statistical difference in both the change in consumption and the change in resistance; dotted grey zone, non‐statistically significant difference in the change in consumption; grey zone, non‐statistically significant difference in the change in resistance.
FIGURE 14
FIGURE 14
Population biomass‐corrected consumption of third‐ and fourth‐generation cephalosporins in humans and food‐producing animals in 29 EU/EEA countries for which data were available both for humans and food‐producing animals, 2021. *For Germany, only community consumption was provided for human medicine. Germany's human consumption data were therefore not included in the weighted mean, as only countries providing total consumption (community and hospital sectors combined) were considered for the population‐weighted mean consumption value. Note: The estimates presented are crude and must be interpreted with caution. For limitations hampering comparison of antimicrobial consumption in humans and food‐producing animals, see Section 15.12. aFor antimicrobial agents included (ATC and ATCvet codes), please refer to Section 3.2. The levels of consumption should be compared with caution between humans and animals, as the calculation of the denominator differs. For details see text box under Figure 8.
FIGURE 15
FIGURE 15
Trend graph of population biomass‐corrected consumption of third‐ and fourth‐generation cephalosporinsa for humans and food‐producing animals in EU/EEA countriesb, mg/kg of estimated biomass, 2014–2021. aFor antimicrobial groups included in overall consumption data (ATC and ATCvet codes), please refer to Section 3.2. bThe countries involved in the analysis may slightly vary between years; consequently, a trend line was not generated, and the specific country names are not listed in this context. The levels of consumption should be compared with caution between humans and animals, as the calculation of the denominator differs. For details see text box under Figure 8. In the box plots, the lowest boundary indicates the 25th percentile, the black horizontal line within the box marks the median and the upper boundary of the box indicates the 75th percentile. The vertical extending lines denote the most extreme values within 1.5 interquartile range of the 25th and 75th percentile of each group. Only outlying observations (outside of this range) are represented as dots.
FIGURE 16
FIGURE 16
Consumption of third‐ and fourth‐generation cephalosporins in humans and the probability of resistance to third‐generation cephalosporins in Escherichia coli, EU/EEA, 2019–2021 (see Table 14). The figure displays results of logistic regression analyses. Bubbles represent the countries included in the analysis. The size of the bubbles indicates the amount of available resistance data per country.
FIGURE 17
FIGURE 17
Consumption of third‐ and fourth‐generation cephalosporins in pigs and the probability of resistance to third‐generation cephalosporins in indicator Escherichia coli from pigs, EU/EEA, 2019 and 2021 (see Table 16). The figure displays results of logistic regression analyses. Bubbles represent the countries included in the analysis. The size of the bubbles indicates the amount of available resistance data per country. A solid trend line indicates significance at a 5% level, whereas a dashed trend line represents significance at a 10% level.
FIGURE 18
FIGURE 18
Probability of resistance to third‐generation cephalosporins in Escherichia coli from humans and calves, EU/EEA, 2019 and 2021 (see Table 17). The figure displays results of logistic regression analyses. Bubbles represent the countries included in the analysis. The size of the bubbles indicates the amount of available resistance data per country.
FIGURE 19
FIGURE 19
Consumption of third‐ and fourth‐generation cephalosporins in food‐producing animals and the prevalence of ESBL‐ and/or AmpC‐producing Escherichia coli in food‐producing animals for 2018–2019, 2019–2020 and 2020–2021 (see Table 18). The figure displays results of logistic regression analyses. Bubbles represent the countries included in the analysis. The size of the bubbles reflects the amount of examined samples per country.
FIGURE 20
FIGURE 20
Consumption of third‐ and fourth‐generation cephalosporins in food‐producing animals, and the probability of resistance to third‐generation cephalosporins in Escherichia coli from humans, EU/EEA, 2019–2021 (see Table 19). The figure displays results of logistic regression analyses. Bubbles represent the countries included in the analysis. The size of the bubbles indicates the amount of available resistance data per country.
FIGURE 21
FIGURE 21
Diagram of PLS‐PM model of resistance to third‐generation cephalosporins in human invasive Escherichia coli (2020–2021), considering resistance to third‐generation cephalosporins in indicator E. coli from food‐producing animals (poultry in 2020 and pigs in 2021), consumption of third‐ and fourth‐generation cephalosporins in humans (2020–2021 mean, expressed as DDD per 1000 inhabitants and per day) and in food‐producing animals (pigs in 2021, expressed as DDDvet/kg of estimated biomass). 27 countries: AT, BE, BG, CY*, CZ*, DE*, DK, EE, EL, ES, FI, FR, HR, HU, IE, IS*, IT, LT, LV, NL, NO, PL, PT, RO, SE, SI, SK. *For these countries, data on human consumption in the hospital sector were not available, and hospital consumption was estimated from the proportion reported by the other countries for the same year. (Goodness‐of‐fit = 0.766).
FIGURE 22
FIGURE 22
Comparison of annual changes in consumption of third‐ and fourth‐generation cephalosporins in humans and resistance to third‐generation cephalosporins in Escherichia coli from humans between 2014 and 2021 by EU/EEA country. White zone, statistical difference in both the change in consumption and the change in resistance; dotted grey zone, non‐statistically significant difference in the change in consumption; grey zone, non‐statistically significant difference in the change in resistance.
FIGURE 23
FIGURE 23
Comparison of annual changes in consumption of third‐ and fourth‐generation cephalosporins in food‐producing animals and resistance to third‐generation cephalosporins in Escherichia coli from food‐producing animals between 2014 and 2021 by EU/EEA country. White zone, statistical difference in both the change in consumption and the change in resistance; dotted grey zone, non‐statistically significant difference in the change in consumption; grey zone, non‐statistically significant difference in the change in resistance.
FIGURE 24
FIGURE 24
Population biomass‐corrected consumption of fluoroquinolones and other quinolones in humans and food‐producing animals in 29 EU/EEA countries for which data were available both for humans and food‐producing animals, 2021. *For Germany, only community consumption was provided for human medicine. Germany's human consumption data were therefore not included in the weighted mean, as only countries providing total consumption (community and hospital sectors combined) were considered for the population‐weighted mean consumption value. Note: The estimates presented are crude and must be interpreted with caution. For limitations hampering comparison of antimicrobial consumption in humans and food‐producing animals, see Section 15.12. aFor antimicrobial agents included (ATC and ATCvet codes), please refer to Section 3.2. The levels of consumption should be compared with caution between humans and animals, as the calculation of the denominator differs. For details see text box under Figure 8.
FIGURE 25
FIGURE 25
Trend graph of population biomass‐corrected consumption of fluoroquinolones and other quinolonesa for humans and food‐producing animals in EU/EEA countriesb, mg/kg of estimated biomass, 2014–2021. aFor antimicrobial groups included in overall consumption data (ATC and ATCvet codes), please refer to Section 3.2. bThe countries involved in the analysis may slightly vary between years; consequently, a trend line was not generated, and the specific country names are not listed in this context. The levels of consumption should be compared with caution between humans and animals, as the calculation of the denominator differs. For details see text box under Figure 8. In the box plots, the lowest boundary indicates the 25th percentile, the black horizontal line within the box marks the median and the upper boundary of the box indicates the 75th percentile. The vertical extending lines denote the most extreme values within 1.5 interquartile range of the 25th and 75th percentile of each group. Only outlying observations (outside of this range) are represented as dots.
FIGURE 26
FIGURE 26
Consumption of fluoroquinolones and other quinolones in humans and the probability of resistance to fluoroquinolones in Escherichia coli from humans, EU/EEA, 2019–2021 (see Table 20). The figure displays results of logistic regression analyses. Bubbles represent the countries included in the analysis. The size of the bubbles indicates the amount of available resistance data per country.
FIGURE 27
FIGURE 27
Consumption of fluoroquinolones and other quinolones in humans and the probability of resistance to fluoroquinolones in Campylobacter jejuni from humans, EU/EEA, 2019–2021 (see Table 21). Bubbles represent the countries included in the analysis. The size of the bubbles indicates the amount of resistance data available per country.
FIGURE 28
FIGURE 28
Consumption of fluoroquinolones and other quinolones in humans and the probability of resistance to fluoroquinolones in Campylobacter coli from humans, EU/EEA, 2019–2021 (see Table 22). Bubbles represent the countries included in the analysis. The size of the bubbles indicates the amount of resistance data available per country.
FIGURE 29
FIGURE 29
Consumption of fluoroquinolones and other quinolones in food‐producing animals and the probability of resistance to ciprofloxacin in indicator Escherichia coli from food‐producing animals, EU/EEA, 2019–2021 (see Table 23). The figure displays curves of logistic regression models. Bubbles represent the countries included in the analysis. The size of the bubbles indicates the amount of available resistance data per country. The category ‘food‐producing animals’ includes broilers, turkeys, pigs and calves. The category ‘quinolones’ includes both fluoroquinolones and other quinolones.
FIGURE 30
FIGURE 30
Consumption of fluoroquinolones and other quinolones in poultry, and the probability of resistance to ciprofloxacin in indicator Escherichia coli and Campylobacter jejuni from poultry in 2020, EU/EEA (see Table 24). The figure displays curves of logistic regression models. Bubbles represent the countries included in the analysis. The size of the bubbles indicates the amount of available resistance data per country. The category ‘quinolones’ includes both fluoroquinolones and other quinolones.
FIGURE 31
FIGURE 31
Consumption of all quinolones in pigs and the probability of resistance to ciprofloxacin in indicator Escherichia coli from slaughter pigs in 2019 and 2021, and Campylobacter coli from slaughter pigs in 2021, EU/EEA (see Table 25). The figure displays results of logistic regression analyses. Bubbles represent the countries included in the analysis. The size of the bubbles indicates the amount of available resistance data per country.
FIGURE 32
FIGURE 32
Probability of resistance to fluoroquinolones in Escherichia coli from humans and pigs, and calves, 2019 and 2021, and broilers and turkeys, 2020 (see Table 27). The figure displays results of logistic regression analyses. Bubbles represent the countries included in the analysis. The size of the bubbles indicates the amount of available resistance data per country.
FIGURE 33
FIGURE 33
Probability of resistance to fluoroquinolones in Campylobacter jejuni from humans and turkeys, EU/EEA, 2020 (see Table 27). The figure displays results of logistic regression analyses. Bubbles represent the countries included in the analysis. The size of the bubbles indicates the amount of available resistance data per country.
FIGURE 34
FIGURE 34
Consumption of fluoroquinolones and other quinolones in food‐producing animals and the probability of resistance to fluoroquinolones in Escherichia coli from humans, EU/EEA, 2019–2021 (see Table 29). The figure displays results of logistic regression analyses. Bubbles represent the countries included in the analysis. The size of the bubbles indicates the amount of available resistance data per country.
FIGURE 35
FIGURE 35
Consumption of fluoroquinolones and other quinolones in food‐producing animals and the probability of resistance to fluoroquinolones in Campylobacter jejuni from humans, EU/EEA, 2019–2021 (see Table 30). The figure displays results of logistic regression analyses. Bubbles represent the countries included in the analysis. The size of the bubbles indicates the amount of available resistance data per country.
FIGURE 36
FIGURE 36
Consumption of fluoroquinolones and other quinolones in food‐producing animals and the probability of resistance to fluoroquinolones in Campylobacter coli from humans, EU/EEA, 2019–2021 (see Table 31). The figure displays results of logistic regression analyses. Bubbles represent the countries included in the analysis. The size of the bubbles indicates the amount of available resistance data per country.
FIGURE 37
FIGURE 37
Diagram of the PLS‐PM of resistance to fluoroquinolones in human invasive Escherichia coli (2020 and 2021), considering resistance to fluoroquinolones in indicator Escherichia coli from food‐producing animals (poultry in 2020 and pigs in 2021) and consumption of fluoroquinolones and other quinolones in humans (2020–2021 mean, expressed as DDD per 1000 inhabitants and per day), and in food‐producing animals (poultry in 2020 and pigs in 2021, expressed as DDDvet/kg of estimated biomass). 27 countries: AT, BE, BG, CY, CZ, DE*, DK, EE, EL, ES, FI, FR, HR, HU, IE, IS, IT, LT, LV, NL, NO, PL, PT, RO, SE, SI, SK. *For Germany, data on human consumption in the hospital sector were not available, and hospital consumption was estimated from the proportion reported by the other countries for the same year. (Goodness‐of‐fit = 0.732).
FIGURE 38
FIGURE 38
Diagram of the PLS‐PM model of resistance to fluoroquinolones in Campylobacter jejuni in humans (in 2020 and 2021), considering resistance to fluoroquinolones in C. jejuni from food‐producing animals (poultry in 2020) and consumption of fluoroquinolones and other quinolones in humans (expressed as DDD per 1000 inhabitants per day for 2020 and 2021) in food‐producing animals (poultry in 2020, expressed as DDDvet/kg of estimated biomass). 20 countries: AT, BG, CY, DE*, DK, EE, ES, FI, FR, HU, IE, IT, LT, NL, NO, PL, PT, SE, SI, SK. *For Germany, data on human consumption in the hospital sector were not available, and hospital consumption was estimated from the proportion reported by the other countries for the same year.
FIGURE 39
FIGURE 39
Diagram of the PLS‐PM model of resistance to fluoroquinolones in Campylobacter coli in humans (in 2020 and 2021), considering resistance to fluoroquinolones in C. coli from food‐producing animals (pigs in 2021) and consumption of fluoroquinolones and other quinolones in humans (expressed as DDD per 1000 inhabitants per day for 2020 and 2021) in food‐producing animals (pigs in 2021, expressed as DDDvet/kg of estimated biomass). 19 countries: AT, CY, DE*, DK, EE, ES, FI, FR, HU, IE, IT, LT, LU, MT, NL, PT, SE, SI, SK. *For Germany, data on human consumption in the hospital sector were not available, and hospital consumption was estimated from the proportion reported by the other countries for the same year.
FIGURE 40
FIGURE 40
Comparison of annual changes in consumption of fluoroquinolones and other quinolones in humans and resistance to fluoroquinolones in Escherichia coli from humans between 2014 and 2021 by EU/EEA country. White zone, statistical difference in both the change in consumption and the change in resistance; dotted grey zone, non‐statistically significant difference in the change in consumption; grey zone, non‐statistically significant difference in the change in resistance.
FIGURE 41
FIGURE 41
Comparison of annual changes in consumption of fluoroquinolones and other quinolones in food‐producing animals and resistance to ciprofloxacin in Escherichia coli from food‐producing animals between 2014 and 2021 by EU/EEA country. White zone, statistical difference in both the change in consumption and the change in resistance; dotted grey zone, non‐statistically significant difference in the change in consumption; grey zone, non‐statistically significant difference in the change in resistance.
FIGURE 42
FIGURE 42
Population biomass‐corrected consumption of polymyxins in humans and food‐producing animals in 29 EU/EEA countries for which data were available both for humans and food‐producing animals, 2021. *For Germany, only community consumption was provided for human medicine. Germany's human consumption data were therefore not included in the weighted mean, as only countries providing total consumption (community and hospital sectors combined) were considered for the population‐weighted mean consumption value. Note: The estimates presented are crude and must be interpreted with caution. For limitations hampering comparison of antimicrobial consumption in humans and food‐producing animals, see Section 15.12. aFor antimicrobial agents included (ATC and ATCvet codes), please refer to Section 3.2. The absolute levels of consumption should not be directly compared between humans and animals as the calculation of the denominator differs. For details see text box under Figure 8.
FIGURE 43
FIGURE 43
Trend graph of population biomass‐corrected consumption of polymyxins(a) for humans and food‐producing animals in EU/EEA countries(b), mg/kg of estimated biomass, 2014–2021. aFor antimicrobial groups included in overall consumption data (ATC and ATCvet codes), please refer to Section 3.2. bThe countries involved in the analysis may slightly vary between years; consequently, a trend line was not generated, and the specific country names are not listed in this context. The absolute levels of consumption should not be directly compared between humans and animals as the calculation of the denominator differs. For details see text box under Figure 8. In the box plots, the lowest boundary indicates the 25th percentile, the black horizontal line within the box marks the median and the upper boundary of the box indicates the 75th percentile. The vertical extending lines denote the most extreme values within 1.5 interquartile range of the 25th and 75th percentile of each group. Only outlying observations (outside of this range) are represented as dots.
FIGURE 44
FIGURE 44
Consumption of polymyxins in food‐producing animals and the probability of resistance to colistin in indicator Escherichia coli from food‐producing animals, EU/EEA, 2019–2021 (see Table 32). The figure displays results of logistic regression analyses. Bubbles represent the countries included in the analysis. The size of the bubbles indicates the amount of available resistance data per country. A solid trend line indicates significance at a 5% level, whereas a dashed trend line represents significance at a 10% level.
FIGURE 45
FIGURE 45
Consumption of polymyxins in pigs and poultry and the probability of resistance to colistin in indicator Escherichia coli from slaughter pigs, 2019 and 2021, and broilers, 2020, EU/EEA (see Table 33). The figure displays results of logistic regression analyses. Bubbles represent the countries included in the analysis. The size of the bubbles indicates the amount of available resistance data per country.
FIGURE 46
FIGURE 46
Comparison of annual changes in consumption of polymyxins in food‐producing animals and resistance to colistin in Escherichia coli from food‐producing animals between 2014 and 2021 by EU/EEA country. White zone, statistical difference in both the change in consumption and the change in resistance; dotted grey zone, non‐statistically significant difference in the change in consumption; grey zone, non‐statistically significant difference in the change in resistance.
FIGURE 47
FIGURE 47
Population biomass‐corrected consumption of aminopenicillins in humans and food‐producing animals in 29 EU/EEA countries for which data were available both for humans and food‐producing animals, 2021. *For Germany, only community consumption was provided for human medicine. Germany's human consumption data were therefore not included in the weighted mean, as only countries providing total consumption (community and hospital sectors combined) were considered for the population‐weighted mean consumption value. Note: The estimates presented are crude and must be interpreted with caution. For limitations hampering comparison of antimicrobial consumption in humans and food‐producing animals, see Section 15.12. aFor antimicrobial agents included (ATC and ATCvet codes), please refer to Section 3.2. The absolute levels of consumption should not be directly compared between humans and animals as the calculation of the denominator differs. For details see text box under Figure 8.
FIGURE 48
FIGURE 48
Trend graph of population biomass‐corrected consumption of aminopenicillins(a) for humans and food‐producing animals in EU/EEA countries(b), mg/kg of estimated biomass, 2014–2021. aFor antimicrobial groups included in overall consumption data (ATC and ATCvet codes), please refer to Section 3.2. bThe countries involved in the analysis may slightly vary between years; consequently, a trend line was not generated, and the specific country names are not listed in this context. The absolute levels of consumption should not be directly compared between humans and animals as the calculation of the denominator differs. For details see text box under Figure 8. In the box plots, the lowest boundary indicates the 25th percentile, the black horizontal line within the box marks the median and the upper boundary of the box indicates the 75th percentile. The vertical extending lines denote the most extreme values within 1.5 interquartile range of the 25th and 75th percentile of each group. Only outlying observations (outside of this range) are represented as dots.
FIGURE 49
FIGURE 49
Consumption aminopenicillins in humans and the probability of resistance to aminopenicillins in Escherichia coli from humans, EU/EEA, 2019–2021 (see Table 34). The figure displays results of logistic regression analyses. Bubbles represent the countries included in the analysis. The size of the bubbles indicates the amount of available resistance data per country.
FIGURE 50
FIGURE 50
Consumption of aminopenicillins in food‐producing animals and the probability of resistance to ampicillin in indicator Escherichia coli from food‐producing animals, EU/EEA, 2019–2021 (see Table 35). The figure displays results of logistic regression analyses. Bubbles represent the countries included in the analysis. The size of the bubbles indicates the amount of available resistance data per country.
FIGURE 51
FIGURE 51
Consumption of aminopenicillins in pigs and the probability of resistance to aminopenicillins in indicator Escherichia coli from slaughter pigs, 2019 and 2021, and poultry (broilers and turkeys), 20, EU/EEA (see Table 36). The figure displays results of logistic regression analyses. Bubbles represent the countries included in the analysis. The size of the bubbles indicates the amount of available resistance data per country.
FIGURE 52
FIGURE 52
Probability of resistance to aminopenicillins in Escherichia coli from humans and from food‐producing animals pigs, calves, 2019 and 2021, and turkeys, broilers, 2020, EU/EEA (see Table 37). The figure displays results of logistic regression analyses. Bubbles represent the countries included in the analysis. The size of the bubbles indicates the amount of available resistance data per country.
FIGURE 53
FIGURE 53
Consumption of aminopenicillins in food‐producing animals and the probability of resistance to aminopenicillins in invasive Escherichia coli from humans, EU/EEA, 2019–2021 (see Table 38). The figure displays results of logistic regression analyses. Bubbles represent the countries included in the analysis. The size of the bubbles indicates the amount of available resistance data per country.
FIGURE 54
FIGURE 54
Diagram of the PLS‐PM of resistance to ampicillin in human invasive Escherichia coli (2020 and 2021), considering resistance to ampicillin in indicator Escherichia coli from food‐producing animals (pigs 2021 and poultry 2020) and consumption of aminopenicillins in humans (2020–2021 mean, expressed as DDD per 1000 inhabitants and per day) and in food‐producing animals (pigs in 2021 and poultry in 2020, expressed as DDDvet/kg of estimated biomass). 26 countries: AT, BE, BG, CY*, CZ*, DE*, DK, EE, EL, ES, FI, FR, HR, HU, IE, IS*, IT, LT, LV, NL, NO, PL, PT, RO, SI, SK. *For these countries, data on human consumption in the hospital sector were not available, and hospital consumption was estimated from the proportion reported by the other countries for the same year. (Goodness‐of‐fit = 0.682).
FIGURE 55
FIGURE 55
Comparison of annual changes in consumption of aminopenicillins in humans and resistance to aminopenicillins of Escherichia coli from humans between 2014 and 2021 by EU/EEA country. White zone, statistical difference in both the change in consumption and the change in resistance; dotted grey zone, non‐statistically significant difference in the change in consumption; grey zone, non‐statistically significant difference in the change in resistance.
FIGURE 56
FIGURE 56
Comparison of annual changes in consumption of aminopenicillins in food‐producing animals and resistance to aminopenicillins of Escherichia coli from food‐producing animals between 2014 and 2021 by EU/EEA country. White zone, statistical difference in both the change in consumption and the change in resistance; dotted grey zone, non‐statistically significant difference in the change in consumption; grey zone, non‐statistically significant difference in the change in resistance.
FIGURE 57
FIGURE 57
Population biomass‐corrected consumption of macrolides for humans and food‐producing animals in 29 EU/EEA countries for which data were available both for humans and food‐producing animals, 2021. *For Germany, only community consumption was provided for human medicine. Germany's human consumption data were therefore not included in the weighted mean, as only countries providing total consumption (community and hospital sectors combined) were considered for the population‐weighted mean consumption value. Note: The estimates presented are crude and must be interpreted with caution. For limitations hampering comparison of antimicrobial consumption in humans and food‐producing animals, see Section 15.12. aFor antimicrobial agents included (ATC and ATCvet codes), please refer to Section 3.2. The absolute levels of consumption should not be directly compared between humans and animals as the calculation of the denominator differs. For details see text box under Figure 8.
FIGURE 58
FIGURE 58
Trend graph of population biomass‐corrected consumption of macrolidesa for humans and food‐producing animals in EU/EEA countriesb, mg/kg of estimated biomass, 2014–2021. aFor antimicrobial groups included in overall consumption data (ATC and ATCvet codes), please refer to Section 3.2. bThe countries involved in the analysis may slightly vary between years; consequently, a trend line was not generated, and the specific country names are not listed in this context. The absolute levels of consumption should not be directly compared between humans and animals as the calculation of the denominator differs. For details see text box under Figure 8. In the box plots, the lowest boundary indicates the 25th percentile, the black horizontal line within the box marks the median and the upper boundary of the box indicates the 75th percentile. The vertical extending lines denote the most extreme values within 1.5 interquartile range of the 25th and 75th percentile of each group. Only outlying observations (outside of this range) are represented as dots.
FIGURE 59
FIGURE 59
Consumption of macrolides in pigs and the probability of resistance to macrolides in Campylobacter coli from slaughter pigs in 2021 (see Table 42). The figure displays results of logistic regression analyses. Bubbles represent the countries included in the analysis. The size of the bubbles indicates the amount of available resistance data per country.
FIGURE 60
FIGURE 60
Consumption of macrolides in food‐producing animals and the probability of resistance to macrolides in Campylobacter jejuni from humans, EU/EEA, 2019–2021 (see Table 45). The figure displays results of logistic regression analyses. Bubbles represent the countries included in the analysis. The size of the bubbles indicates the amount of available resistance data per country. A solid trend line indicates significance at a 5% level, whereas a dashed trend line represents significance at a 10% level.
FIGURE 61
FIGURE 61
Diagram of the PLS‐PM of resistance to macrolides in Campylobacter coli from humans (2021), considering resistance to macrolides in C. coli from food‐producing animals (pigs in 2021), consumption of macrolides in humans (2021, expressed as DDD per 1000 inhabitants and per day) and consumption of macrolides in pigs (in 2021, expressed as DDDvet/kg of estimated biomass). 17 countries: AT, DE, DK, EE, ES, FI, FR, JU, IE, IT, LT, LU, MT, NL, PT, SI, SK.
FIGURE 62
FIGURE 62
Population biomass‐corrected consumption of tetracyclines for humans and food‐producing animals in 29 EU/EEA countries for which data were available both for humans and food‐producing animals, 2021. *For Germany, only community consumption was provided for human medicine. Germany's human consumption data were therefore not included in the weighted mean, as only countries providing total consumption (community and hospital sectors combined) were considered for the population‐weighted mean consumption value. Note: The estimates presented are crude and must be interpreted with caution. For limitations hampering comparison of antimicrobial consumption in humans and food‐producing animals, see Section 15.12. aFor antimicrobial agents included (ATC and ATCvet codes), please refer to Section 3.2. The absolute levels of consumption should not be directly compared between humans and animals as the calculation of the denominator differs. For details see text box under Figure 8.
FIGURE 63
FIGURE 63
Trend graph of population biomass‐corrected consumption of tetracyclinesa for humans and food‐producing animals in EU/EEA countriesb, mg/kg of estimated biomass, 2014–2021. aFor antimicrobial groups included in overall consumption data (ATC and ATCvet codes), please refer to Section 3.2. bThe countries involved in the analysis may slightly vary between years; consequently, a trend line was not generated, and the specific country names are not listed in this context. The absolute levels of consumption should not be directly compared between humans and animals as the calculation of the denominator differs. For details see text box under Figure 8. In the box plots, the lowest boundary indicates the 25th percentile, the black horizontal line within the box marks the median and the upper boundary of the box indicates the 75th percentile. The vertical extending lines denote the most extreme values within 1.5 interquartile range of the 25th and 75th percentile of each group. Only outlying observations (outside of this range) are represented as dots.
FIGURE 64
FIGURE 64
Consumption of tetracyclines in food‐producing animals and the probability of resistance to tetracyclines in indicator Escherichia, EU/EEA, 2019–2021 (see Table 49). The figure displays the results of logistic regression analyses. Bubbles represent the countries included in the analysis. The size of the bubbles indicates the amount of available resistance data per country. Category ‘food‐producing animals’ includes broilers, turkeys, pigs and calves for all three time considered intervals.
FIGURE 65
FIGURE 65
Consumption of tetracyclines in poultry, expressed as DDDvet/kg of estimated biomass/year, and the probability of resistance to tetracyclines in indicator Escherichia coli, and Campylobacter jejuni from poultry in 2020 EU/EEA (see Table 50). The figure displays the results of logistic regression analyses. Bubbles represent the countries included in the analysis. The size of the bubbles indicates the amount of available resistance data per country.
FIGURE 66
FIGURE 66
Consumption of tetracyclines in pigs, expressed as DDDvet/kg of estimated biomass/year, and the probability of resistance to tetracyclines in indicator Escherichia coli from slaughter pigs, 2019 and 2021, and Campylobacter coli from slaughter pigs, 2021, EU/EEA (see Table 50). The figure displays the results of logistic regression analyses. Bubbles represent the countries included in the analysis. The size of the bubbles indicates the amount of available resistance data per country.
FIGURE 67
FIGURE 67
Probability of tetracycline resistance in Campylobacter jejuni from humans and broilers and turkeys, EU/EEA, 2020 (see Table 51). The figure displays the results of logistic regression analyses. Bubbles represent the countries included in the analysis. The size of the bubbles indicates the amount of available resistance data per country.
FIGURE 68
FIGURE 68
Probability of tetracycline resistance in Campylobacter coli from humans and pigs, EU/EEA, 2021 (see Table 52). The figure displays the results of logistic regression analyses. Bubbles represent the countries included in the analysis. The size of the bubbles indicates the amount of available resistance data per country.
FIGURE 69
FIGURE 69
Consumption of tetracyclines in food‐producing animals and the probability of resistance to tetracyclines in Campylobacter jejuni from humans, EU/EEA, 2019–2021 (see Table 53). The figure displays the results of logistic regression analyses. Bubbles represent the countries included in the analysis. The size of the bubbles indicates the amount of available resistance data per country.
FIGURE 70
FIGURE 70
Diagram of PLS‐PM model of resistance to tetracyclines in Campylobacter jejuni from humans (2020 and 2021), considering resistance to tetracyclines in C. jejuni from food‐producing animals (poultry in 2020), consumption of tetracyclines in humans (2020–2021 mean, expressed as DDD per 1000 inhabitants and per day) and in poultry (in 2020, expressed as DDDvet/kg of estimated biomass). 20 countries: AT, BG, CY*, DE*, DK, EE, ES, FI, FR, HU, IE, IT, LT, NL, NO, PL, PT, SE, SI, SK. *For these countries, data on human consumption in the hospital sector were not available, and hospital consumption was estimated from the proportion reported by the other countries for the same year.
FIGURE 71
FIGURE 71
Comparison of annual changes in consumption of tetracyclines in food‐producing animals and resistance to tetracyclines in Escherichia coli from food‐producing animals between 2014 and 2021 by EU/EEA country. White zone, statistical difference in both the change in consumption and the change in resistance; dotted grey zone, non‐statistically significant difference in the change in consumption; grey zone, non‐statistically significant difference in the change in resistance.
FIGURE 72
FIGURE 72
Total national AMC in food‐producing animals and the probability of complete susceptibility to the harmonised set of substances tested in indicator Escherichia coli isolates from food‐producing animals for 2018–2019, 2019–2020 and 2020–2021, EU/EEA (see Table 56). The figure displays results of logistic regression analyses. Bubbles represent the countries included in the analysis. The size of the bubbles indicates the amount of available resistance data per country.
FIGURE 73
FIGURE 73
Total national AMC in humans and probability of complete susceptibility to the harmonised set of substances* tested in Escherichia coli from humans, EU/EEA, 2019–2021 (see Table 57). The figure displays the results of logistic regression analyses. Bubbles represent the countries included in the analysis. The size of the bubbles indicates the amount of available resistance data per country. *Fluoroquinolones, third‐generation cephalosporins, aminoglycosides and carbapenems. As the definition of complete susceptibility differs no integrated analysis could be performed.
FIGURE 74
FIGURE 74
Comparison of annual changes in total consumption in humans and complete susceptibility in E. coli isolates from humans, EU/EEA, 2014–2021. White zone: statistical difference in both the change in consumption and the change in resistance; dotted grey zone: non‐statistically significant difference in the change in consumption; grey zone: non‐statistically significant difference in the change in resistance.
FIGURE 75
FIGURE 75
Comparison of annual changes in total consumption in food‐producing animals and complete susceptibility in Escherichia coli from food‐producing animals, EU/EEA, 2014–2021. White zone, statistical difference in both the change in consumption and the change in resistance; dotted grey zone, non‐statistically significant difference in the change in consumption; grey zone, non‐statistically significant difference in the change in resistance.
FIGURE A.1
FIGURE A.1
Diagram showing the notations followed in the multivariate analyses between 2014 and 2021 considering antimicrobial consumption and resistance data from Escherichia coli in both humans and food‐producing animals.
FIGURE B.1
FIGURE B.1
Consumption of third‐ and fourth‐generation cephalosporins in humans and the probability of resistance to third‐generation cephalosporins in Salmonella spp., EU/EEA, 2019–2021 (see Table B.1). The figure displays results of logistic regression analyses. Bubbles represent the countries included in the analysis. The size of the bubbles indicates the amount of available resistance data per country. A solid trend line indicates significance at a 5% level, whereas a dashed trend line represents significance at a 10% level.
FIGURE B.2
FIGURE B.2
Consumption of third‐ and fourth‐generation cephalosporins in pigs and the probability of resistance to third‐generation cephalosporins in Salmonella spp. from pigs, EU/EEA, 2021 (see Table B.1). The figure displays results of logistic regression analyses. Bubbles represent the countries included in the analysis. The size of the bubbles indicates the amount of available resistance data per country.
FIGURE B.3
FIGURE B.3
Probability of resistance to third‐generation cephalosporins in Salmonella SIMR from food‐producing animals and humans, EU/EEA, 2019–2021 (see Table B.4).
FIGURE B.4
FIGURE B.4
Probability of resistance to third‐generation cephalosporins in Salmonella spp. from humans and pig carcasses, 2019 and 2021, and broilers and turkeys, 2020, EU/EEA (see Table B.5). The figure displays results of logistic regression analyses. Bubbles represent the countries included in the analysis. The size of the bubbles indicates the amount of available resistance data per country.
FIGURE B.5
FIGURE B.5
Consumption of fluoroquinolones and other quinolones in food‐producing animals and the probability of resistance to fluoroquinolones in indicator Salmonella spp., EU/EEA, 2019–2021 (see Table B.8). The figure displays results of logistic regression analyses. Bubbles represent the countries included in the analysis. The size of the bubbles indicates the amount of available resistance data per country.
FIGURE B.6
FIGURE B.6
Probability of resistance to fluoroquinolones and other quinolones in Salmonella SIMR from humans and food‐producing animals, EU/EEA, 2019–2021 (see Table B.10). The figure displays results of logistic regression analyses. Bubbles represent the countries included in the analysis. The size of the bubbles indicates the amount of available resistance data per country.
None
FIGURE B.7 Probability of resistance to fluoroquinolones and other quinolones in Salmonella spp. from humans and broilers, EU/EEA, 2020 (see Table B.11). The figure displays results of logistic regression analyses. Bubbles represent the countries included in the analysis. The size of the bubbles indicates the amount of available resistance data per country.
FIGURE B.8
FIGURE B.8
Consumption of fluoroquinolones and other quinolones in food‐producing animals and the probability of resistance to fluoroquinolones in Salmonella spp. from humans, EU/EEA, 2019–2021 (see Table B.12). The figure displays the results of logistic regression analyses. Bubbles represent the countries included in the analysis. The size of the bubbles indicates the amount of available resistance data per country.
FIGURE B.9
FIGURE B.9
Diagram of the PLS‐PM model of resistance to fluoroquinolones in Salmonella spp. from humans (in 2020 and 2021), considering resistance to fluoroquinolones in Salmonella spp. from food‐producing animals (poultry in 2020 and pigs in 2021) and consumption of fluoroquinolones and other quinolones in humans (2020–2021) mean, expressed as DDD per 1000 inhabitants and per day) in food‐producing animals (in poultry for 2020 and in pigs for 2021, expressed as DDDvet/kg of estimated biomass), EU/EEA. 14 countries: BE, DE*, EL, ES, FR, HU, IT, LV, MT, PL, PT, RO, SI, SK. *For this country, data on human consumption in the hospital sector were not available, and hospital consumption was estimated from the proportion reported by the other countries for the same year. (Goodness‐of‐fit = 0.492).
FIGURE B.10
FIGURE B.10
Probability of resistance to aminopenicillins in Salmonella SIMR from humans and food‐producing animals, EU/EEA, 2019–2021 (see Table B.18). The figure displays the results of logistic regression analyses. Bubbles represent the countries included in the analysis. The size of the bubbles indicates the amount of available resistance data per country.
FIGURE B.11
FIGURE B.11
Consumption of aminopenicillins in food‐producing animals and the probability of resistance to aminopenicillins in Salmonella spp. from humans, EU/EEA, 2019–2021 (see Table B.20). The figure displays results of logistic regression analyses. Bubbles represent the countries included in the analysis. The size of the bubbles indicates the amount of available resistance data per country. A solid trend line indicates significance at a 5% level, whereas a dashed trend line represents significance at a 10% level.
FIGURE B.12
FIGURE B.12
Consumption of tetracyclines in food‐producing animals and the probability of resistance to tetracyclines in indicator Salmonella spp. from food‐producing animals, EU/EEA, 2019–2021 (see Table B.22). The figure displays the results of logistic regression analyses. Bubbles represent the countries included in the analysis. The size of the bubbles indicates the amount of available resistance data per country. Category ‘food‐producing animals’ includes broilers, turkeys, pigs and calves for all three time considered intervals.
FIGURE B.13
FIGURE B.13
Consumption of tetracyclines in food‐producing animals and the probability of resistance to tetracyclines in Salmonella spp. from humans, EU/EEA, 2019–2021 (see Table B.26). The figure displays the results of logistic regression analyses. Bubbles represent the countries included in the analysis. The size of the bubbles indicates the amount of available resistance data per country.

References

    1. AbuOun, M. , Stubberfield, E. J. , Duggett, N. A. , Kirchner, M. , Dormer, L. , Nunez‐Garcia, J. , Randall, L. P. , Lemma, F. , Crook, D. W. , Teale, C. , Smith, R. P. , & Anjum, M. F. (2017). Mcr‐1 and mcr‐2 variant genes identified in Moraxella species isolated from pigs in Great Britain from 2014 to 2015. Journal of Antimicrobial Chemotherapy, 72(10), 2745–2749. - PMC - PubMed
    1. Akaike, H. (1983). Information measures and model selection. Bulletin de Institute Statistique Institute, 50, 277–290.
    1. AMEG (European Medicines Agency and Antimicrobial Advice Ad Hoc Expert Group) . (2016). Updated advice on the use of colistin products in animals within the European Union: development of resistance and possible impact on human and animal health (EMA/CVMP/CHMP/231573/2016). https://www.ema.europa.eu/documents/scientific‐guideline/updated‐advice‐...
    1. AMEG (European Medicines Agency and Antimicrobial Advice Ad Hoc Expert Group) . (2019). Categorisation of antibiotics in the European Union (EMA/CVMP/CHMP/682198/2017). https://www.ema.europa.eu/en/documents/report/categorisation‐antibiotics...
    1. ANSES (The French Agency for Food Environmental and Occupational Health & Safety) . (2018). Sales survey of veterinary medicinal products containing antimicrobials in France in 2017. Annual Report.

LinkOut - more resources