. 2024 Feb 9;27(3):109170.
doi: 10.1016/j.isci.2024.109170. eCollection 2024 Mar 15.

Noninvasive total counting of cultured cells using a home-use scanner with a pattern sheet

Affiliations

Noninvasive total counting of cultured cells using a home-use scanner with a pattern sheet

Mitsuru Mizuno et al. iScience. .

Abstract

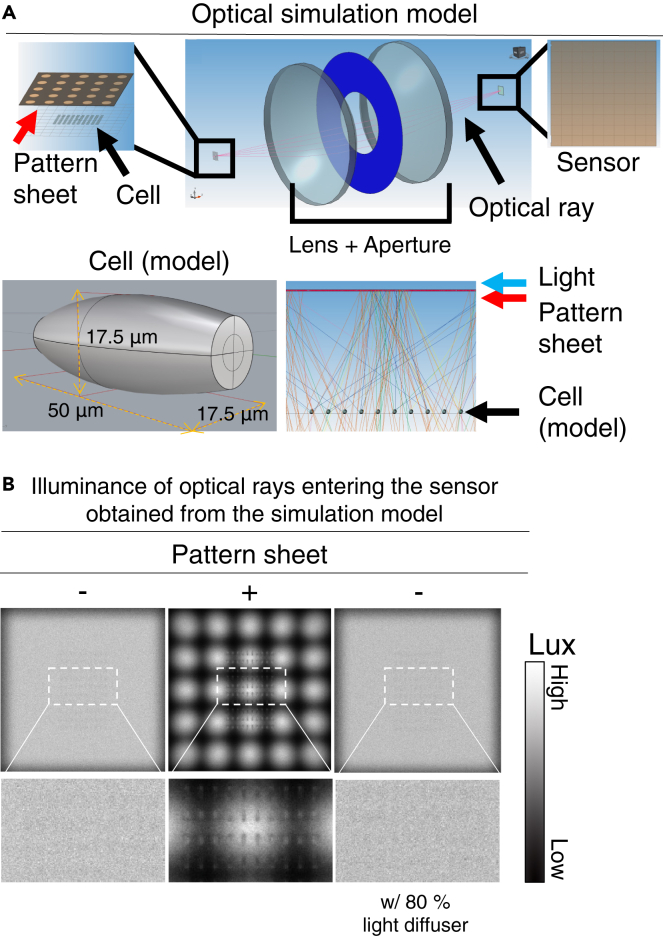
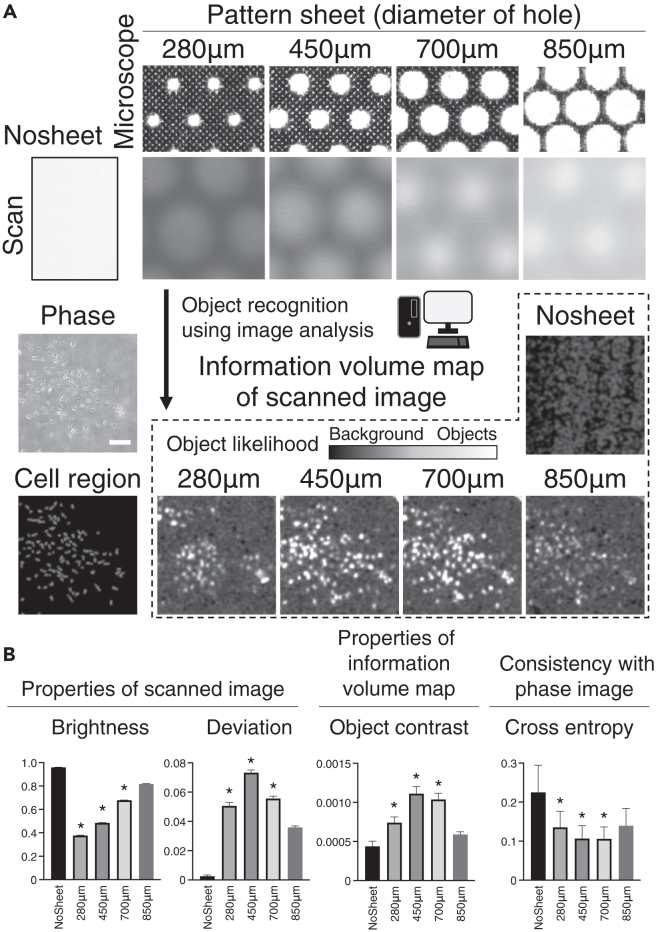
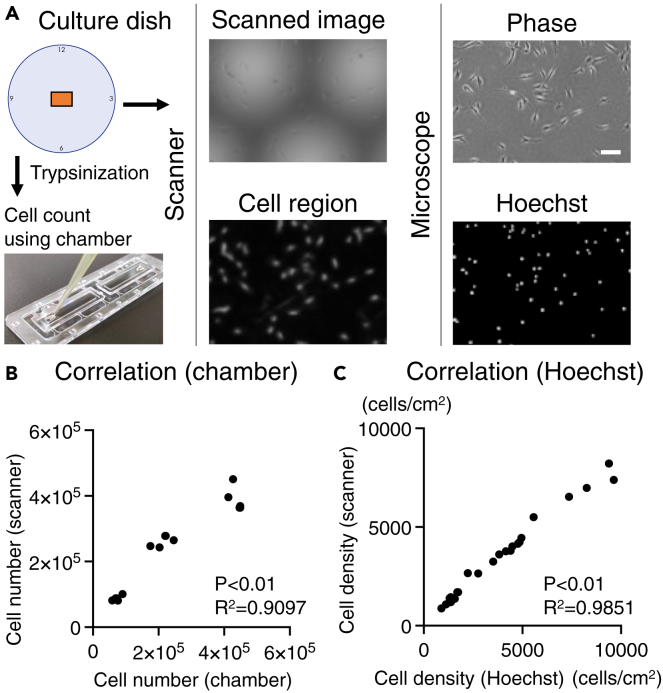
The inherent variability in cell culture techniques hinders their reproducibility. To address this issue, we introduce a comprehensive cell observation device. This new approach enhances the features of existing home-use scanners by implementing a pattern sheet. Compared with fluorescent staining, our method over- or underestimated the cell count by a mere 5%. The proposed technique showcased a strong correlation with conventional methodologies, displaying R2 values of 0.91 and 0.99 compared with the standard chamber and fluorescence methods, respectively. Simulations of microscopic observations indicated the potential to estimate accurately the total cell count using just 20 fields of view. Our proposed cell-counting device offers a straightforward, noninvasive means of measuring the number of cultured cells. By harnessing the power of deep learning, this device ensures data integrity, thereby making it an attractive option for future cell culture research.

Keywords: Biotechnology; Machine learning; Optical imaging.


Conflict of interest statement

A patent application for this technology has been submitted in Japan.

Figures

None
Graphical abstract
Figure 1
Figure 1
Schema of scan imaging (A) Overview diagram of scan imaging. The blue, red, and green arrows respectively indicate the position of the light, position of the pattern sheet, and position of the sensor, respectively. (B) Schema of scan imaging for cultured cells without a pattern sheet (left) and with a pattern sheet (right). (C) Scanned image of cultured cells without a pattern sheet (left) and with a pattern sheet (right). Scale bar is 1 cm. (D) Proposed mechanism for cell visualization without (left) and with a pattern sheet (right). The colored lines represent diffuse light from a white LED, and the black line extracts a representative optical ray. The center circle is assumed to be a cell. The red lines at the bottom of the figure represent intensity profiles at the sensor, and the right side of each figure presents the optical ray refracted at the cells.
Figure 2
Figure 2
Optical simulation model (A) Optical simulation model for our scan imaging. LEDs (as general diffuse light sources), pattern sheets, and model cells were created for simulations (see further optical properties in Table S1). The transmitted optical rays were focused by a lens and observed by a charged-coupled device sensor. Model cells on the observation surface were prepared and lined up (numbers of cells was 10 × 10). The refractive index (RI) of model cells was set to 1.360 and the diffusion ratio of model cells was assumed to be 0.3. (B) Illuminances of optical rays detected by the sensor with and without pattern sheet and under 80% light-diffused conditions. Color scale bars denote illuminances (Lx: lm/m2). Detailed condition settings of the simulation model are shown in Table S1.
Figure 3
Figure 3
Cell detection by scanning (A) Schema of examination, and (B) scan image, and information volume map (IVM) image are shown. IVM images were visualized as objects from scanned images using patterned, black, and gray sheets. Scale bar is 100 μm. (C) Image brightness and differences in brightness in a 10-pixel radius for each image are presented along the y axis. The x axis represents the coordinates in the images. (D) Correlation diagram of the quantification of the IVM values in the form of object visibility and differences in brightness in regions with a 10-pixel radius; P and R values were calculated using Spearman’s correlation coefficient.
Figure 4
Figure 4
Selection of pattern sheet based on the evaluation of scanned images (A) Microscopic image of each pattern sheet scanned image for each pattern sheet and without the use of sheets, and phase image and cell region of the phase image (left). Information volume map of the scanned image after cell recognition using deep learning (right). The color bar represents deep-learning judgment results between cells and the background. Scale bar is 500 μm. (B) Properties of the scanned image in terms of brightness and deviation (left), and properties of information volume map derived from the scanned image in terms of contrast (middle). Evaluation of consistency between phase image and information volume map using cross-entropy (right). Data are presented as mean ± standard deviation (SD). ∗p < 0.05 for comparisons with the value at NoSheet using the Kruskal–Wallis test with Dunn’s test.
Figure 5
Figure 5
Accuracy of scan imaging (A) Types of error associated with overdetection. Representative images for error types of image origin (left) and large cells (right). The scanned image (Scan) and phase represent a raw image. Image of the cell region (Region) and Hoechst-stained image shown in pseudo color. Yellow arrows indicate the differences between each image. Scale bar is 100 μm. (B) Percentage of each error identified in nine images. Data are presented as mean ± SD. (C) Types of errors associated with under-detection. Representative images for error types of the dead angle (left) and lack of resolution (right). (D) Percentage of each error identified in nine images. Data are presented as mean ± SD. (E) Accuracy at each cell density from low to high density. (F) Detection error at each density. Data are presented as mean ± SD.
Figure 6
Figure 6
Comparison to conventional methods (A) Methods of comparison between scanned image cell counts and cell counting using a chamber or Hoechst-stained images. Scale bar is 100 μm. (B) Correlation between cell number in the entire dish and cell count using a chamber (n = 15). (C) Correlation between scanned image and Hoechst-stained image. Comparisons with Hoechst-stained images were performed based on cell density (cells/cm2) calculated from 5 × 5 fields of view at the same location in a scanned image (n = 25).
Figure 7
Figure 7
Usefulness of whole-dish imaging (A) Time evolution of the cell number calculated from time-lapse scanned images. (B) Locations of 25 arbitrarily extracted pseudo-microscopic fields of view and area of the captured images (mm2). Scale bar is 1 cm. (C) Discrepancy compared with the total cell number calculated from scanned images. The total cell number calculated from the scanned image was 0%. The horizontal axis represents elapsed time. Individual fields are presented with data from 25 fields of view (left). For the groups of three and five fields, the graph presents five average values randomly selected from 25 fields of view (middle). For the groups of 10 and 20 fields, the graph presents five average values randomly selected from 25 fields of view (right). (D) Scanned images and cell regions captured at 0 and 132 h. Representative locations are highlighted by blue and red squares, respectively. (E) Discrepancy between the number of cells in each field of view and the total number of cells at 0 and 132 h. Data are presented as maximum to minimum and average values.

Similar articles

References

    1. Altman D.G. The scandal of poor medical research. BMJ. 1994;308:283–284. doi: 10.1136/bmj.308.6924.283. - DOI - PMC - PubMed
    1. Kaiser J. If you fail to reproduce another scientist’s results, this journal wants to know. Science. 2016;354:1220. doi: 10.1126/science.aae0310. - DOI - PubMed
    1. Baker M. Biotech giant publishes failures to confirm high-profile science. Nature. 2016;530:141. doi: 10.1038/nature.2016.19269. - DOI - PubMed
    1. Freedman L.P., Gibson M.C., Ethier S.P., Soule H.R., Neve R.M., Reid Y.A. Reproducibility: changing the policies and culture of cell line authentication. Nat. Methods. 2015;12:493–497. doi: 10.1038/nmeth.3403. - DOI - PubMed
    1. Goodman S.N., Fanelli D., Ioannidis J.P.A. What does research reproducibility mean? Sci. Transl. Med. 2016;8:341ps12. doi: 10.1126/scitranslmed.aaf5027. - DOI - PubMed

LinkOut - more resources