[Preprint]. 2025 Sep 22:2024.02.11.579839.
doi: 10.1101/2024.02.11.579839.

Scalable nonparametric clustering with unified marker gene selection for single-cell RNA-seq data

Affiliations

Scalable nonparametric clustering with unified marker gene selection for single-cell RNA-seq data

Chibuikem Nwizu et al. bioRxiv. .

Abstract

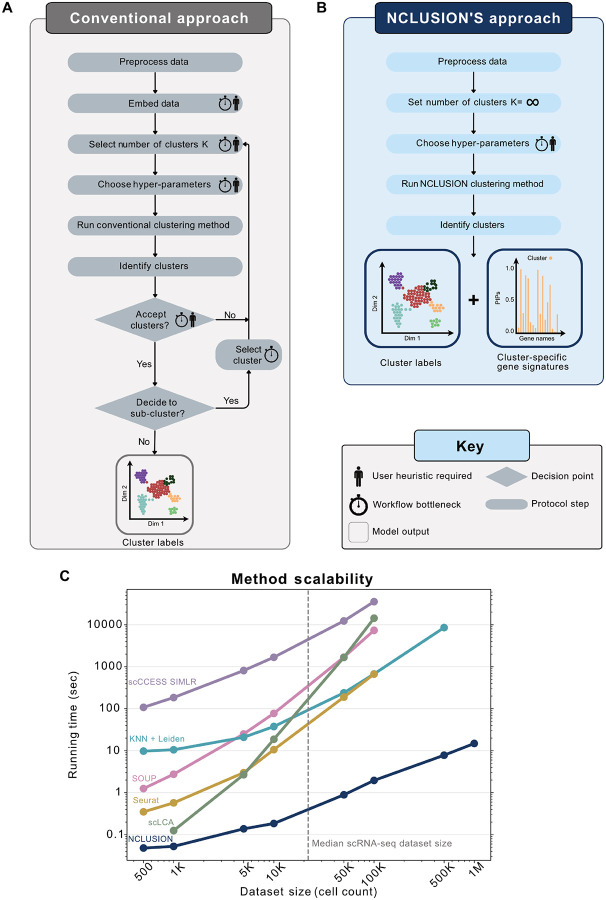
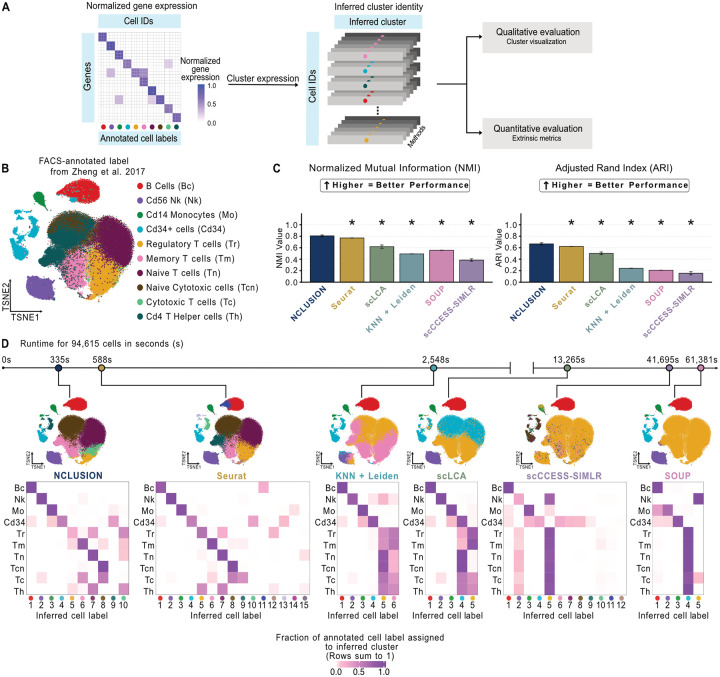
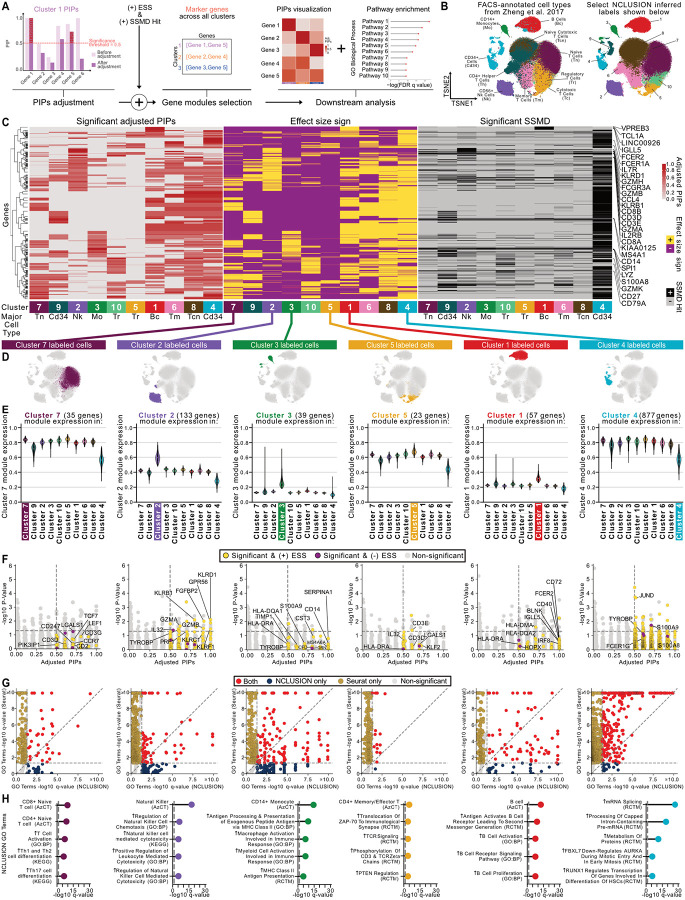
Clustering is commonly used in single-cell RNA-sequencing (scRNA-seq) pipelines to characterize cellular heterogeneity. However, current methods face two main limitations. First, they require user-specified heuristics which add time and complexity to bioinformatic workflows; second, they rely on post-selective differential expression analyses to identify marker genes driving cluster differences, which has been shown to be subject to inflated false discovery rates. We address these challenges by introducing nonparametric clustering of single-cell populations (NCLUSION): an infinite mixture model that leverages Bayesian sparse priors to identify marker genes while simultaneously performing clustering on single-cell expression data. NCLUSION uses a scalable variational inference algorithm to perform these analyses on datasets with up to millions of cells. Through simulations and analyses of publicly available scRNA-seq studies, we demonstrate that NCLUSION (i) matches the performance of other state-of-the-art clustering techniques with significantly reduced runtime and (ii) provides statistically robust and biologically relevant transcriptomic signatures for each of the clusters it identifies. Overall, NCLUSION represents a reliable hypothesis-generating tool for understanding patterns of expression variation present in single-cell populations.


Conflict of interest statement

SR holds equity in Amgen. PSW reports compensation for consulting/speaking from Engine Ventures and AbbVie unrelated to this work. AKS reports compensation for consulting and/or scientific advisory board membership from Honeycomb Biotechnologies, Cellarity, Ochre Bio, Relation Therapeutics, Fog Pharma, Bio-Rad Laboratories, IntrECate Biotherapeutics, Passkey Therapeutics and Dahlia Biosciences unrelated to this work. SR and PSW receive research funding from Microsoft. MH, NF, APA, and LC are employees of Microsoft and own equity in Microsoft. All other authors have declared that no competing interests exist.

Figures

Fig 1.
Fig 1.. NCLUSION provides a scalable, unified workflow for both clustering and marker gene selection in single-cell analysis.
(A) Conventional clustering algorithms require user heuristics and decision making steps that increase wall clock runtime (e.g., selection and human-in-the-loop refinement of the number of clusters K). (B) The nonparameteric workflow of NCLUSION reduces the number of choices and heuristics that users have to make while also performing cluster-specific variable selection to identify top marker genes for downstream investigation. (C) Runtimes of NCLUSION and other baselines on the BRAIN-LARGE dataset with a fixed set of 720 genes and an increasing sample size ranging from N=500 to 1 million cells.
Fig 2.
Fig 2.. Comparing NCLUSION and competing algorithms on performing clustering and marker gene selection in a simulation study.
Depicted are results for Scenario I where we evenly distributed all synthetically generated cells across five clusters and each cluster had a unique set of 50 marker genes. (A) Overview of the simulation framework used for evaluating the quality of clustering and marker gene selection for NCLUSION and each competing method. (B) Inferred cluster labels were compared to “true” annotations created during the simulation, where performance was measured according to (left) normalized mutual information (NMI) and (right) adjusted Rand index (ARI). (C) Assessment of marker gene selection was done on the global scale, where methods were evaluated on how well they could detect a “true” causal gene without taking cluster assignment into account. This was due to the limitation of competing methods not being able to identify cluster-specific genes. Evaluations were done by measuring the true positive rate (TPR; or power), false discovery rate (FDR), and false positive rate (FPR; computed as 1-Specificity) for each approach. Results for (B) and (C) are based on 20 simulations, with each bar plot representing the mean and the error bars covering a ± 95% confidence interval.
Fig 3.
Fig 3.. Clustering performance for NCLUSION and other baseline methods on the PBMC scRNA-seq dataset (N=94,615cells).
(A) The framework used for evaluating the quality of clustering in each method. (B) Overview of FACS-based cell type annotations, visualized via t-distributed stochastic neighbor embedding (t-SNE), for the PBMC scRNA-seq dataset. These annotations serve as labels during the evaluation. (C) Assessment of the inferred cluster labels versus the experimental annotations, as quantified by two metrics: normalized mutual information (NMI) and adjusted Rand index (ARI) (for each method, we take five random 80% splits of the PBMC dataset; depicted in each bar plot is the mean ± 95% confidence interval). Asterisks indicate that there is a statistically significant difference in performance between NCLUSION and a corresponding method (two-sided t-test P<0.05). (D) Visualizing the structure of the inferred clusters across all baselines using t-SNEs and a contingency heat map showing the prevalence of each cell type within each cluster. Methods are ordered from fastest (left) to slowest (right) in terms of runtime. The same lower dimensional representation of the data is reused with relabeling of the plots according to the results from each clustering algorithm.
Fig 4.
Fig 4.. Evaluation of cluster-specific marker genes identified by NCLUSION on the PBMC dataset (N=94,615cells).
(A) The framework used for assessing cluster-specific marker genes. (B) Embeddings of the experimental annotations for major cell types from the PBMC dataset compared to the clusters inferred by NCLUSION. (C) Heat maps of the adjusted posterior inclusion probabilities (PIPs) (left), effect size sign (ESS) (center), and strictly standardized mean difference (SSMD) (right) of significant genes in each cluster. Cluster-specific marker genes are selected as those that have a significant inclusion probability, are up-regulated in a given cluster, and have a large effect size magnitude such that PIP ≥ 0.5, ESS = +, and |SSMD(j;k)|S*(j;k), respectively. Here S*(j;k) is a threshold set to preserve a false positive rate of 0.05. (D) Highlighted location on t-SNEs of NCLUSION-inferred clusters that contain predominantly one cell type. (E) Violin plots comparing the normalized expression of cluster-specific marker genes in each of the inferred clusters. (F) Scatter plot comparing the marker genes identified using post hoc differential expression analysis with Seurat (yellow) versus the variable selection approach with NCLUSION (blue). Yellow points have PIP ≥ 0.5 and ESS = +, while purple points have PIP ≥ 0.5 and ESS = −, respectively. The vertical dashed line marks the median probability criterion, and the horizontal dashed line marks the Bonferroni-corrected threshold for significant q-values (i.e., an adjusted P). Genes in the top right quadrant are identified by both methods. (G) Scatter plot comparing gene ontology (GO) pathway enrichment analyses using cluster-specific marker genes from Seurat versus NCLUSION. The horizontal and vertical lines correspond to significant q-values being below 0.05. Pathways in the top right quadrant are selected by both approaches (red), while elements in the bottom right and top left quadrants are uniquely identified by NCLUSION (blue) and Seurat (orange), respectively. (H) Highlight of select top GO pathway enrichment analysis for the marker genes identified by NCLUSION. Plotted on the x-axis are the negative log-transformed q-values for each GO gene set. Gene sets with a q-value below 0.05 are deemed to be significant.
Fig 5.
Fig 5.. Scalability and generalizability of NCLUSION across diverse datasets.
NCLUSION and baselines were applied to the following scRNA-seq datasets: PDAC (N=23,042cells), AML (N=43,690cells), and IMMUNE (N=88,057cells). (A) Runtimes for all methods when applied to each dataset. (B) Assessment of the inferred cluster labels from each method versus cell type annotations from the original studies. Evaluation is quantified by normalized mutual information (NMI) and adjusted Rand index (ARI). Asterisks indicate that there is a statistically significant difference in performance between NCLUSION and a corresponding method (two-sided t-test P<0.05). Panels (C)-(F) depict results from running NCLUSION on the PDAC dataset. (C) Shown is a t-SNE visualization of the PDAC scRNA-seq dataset, annotated by the cell type labels from the PDAC study (top) compared to the clusters inferred by NCLUSION (bottom), where the “NM” labels indicate non-malignant cells and the “M” labels indicate malignant cells. (D) Heat maps of the adjusted posterior inclusion probabilities (PIPs) (left), effect size sign (ESS) (center), and strictly standardized mean difference (SSMD) (right) of the significant genes in each cluster. (E) Highlighted location on t-SNEs of NCLUSION-inferred clusters that contain predominantly one cell type. (F) Violin plots comparing the normalized expression of cluster-specific marker genes across clusters. (G) Gene ontology (GO) pathway enrichment analysis for the marker genes identified for each cluster. Gene sets with a q-value below 0.05 are deemed to be significant.

References

    1. Miao Zhen, Humphreys Benjamin D., McMahon Andrew P., and Kim Junhyong. Multi-omics integration in the age of million single-cell data. Nature Reviews Nephrology, 17(11):710–724, November 2021. ISSN 1759–5061, 1759–507X. doi: 10.1038/s41581-021-00463-x. - DOI - PMC - PubMed
    1. Alexander Wolf F., Angerer Philipp, and Theis Fabian J.. Scanpy: large-scale single-cell gene expression data analysis. Genome Biology, 19(1):15, February 2018. ISSN 1474–760X. doi: 10.1186/s13059-017-1382-0. - DOI - PMC - PubMed
    1. Guo Minzhe, Wang Hui, Potter S. Steven, Whitsett Jeffrey A., and Xu Yan. Sincera: A pipeline for single-cell rna-seq profiling analysis. PLOS Computational Biology, 11(11):e1004575, November 2015. ISSN 1553–7358. doi: 10.1371/journal.pcbi.1004575. - DOI - PMC - PubMed
    1. Lun Aaron T.L., McCarthy Davis J., and Marioni John C.. A step-by-step workflow for low-level analysis of single-cell rna-seq data with bioconductor. F1000Research, 5:2122, October 2016. ISSN 2046–1402. doi: 10.12688/f1000research.9501.2. - DOI - PMC - PubMed
    1. Haque Ashraful, Engel Jessica, Teichmann Sarah A., and Lönnberg Tapio. A practical guide to single-cell rna-sequencing for biomedical research and clinical applications. Genome Medicine, 9 (1):75, August 2017. ISSN 1756–994X. doi: 10.1186/s13073-017-0467-4. - DOI - PMC - PubMed

Publication types