[Preprint]. 2024 Mar 7:2024.02.11.579850.
doi: 10.1101/2024.02.11.579850.

DNA methylation-dependent and -independent binding of CDX2 directs activation of distinct developmental and homeostatic genes

Affiliations

DNA methylation-dependent and -independent binding of CDX2 directs activation of distinct developmental and homeostatic genes

Alireza Lorzadeh et al. bioRxiv. .

Abstract

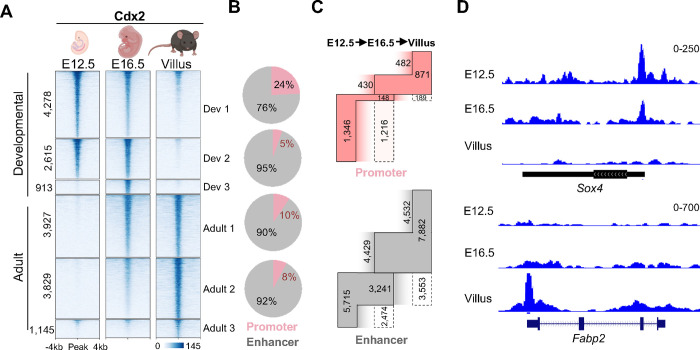
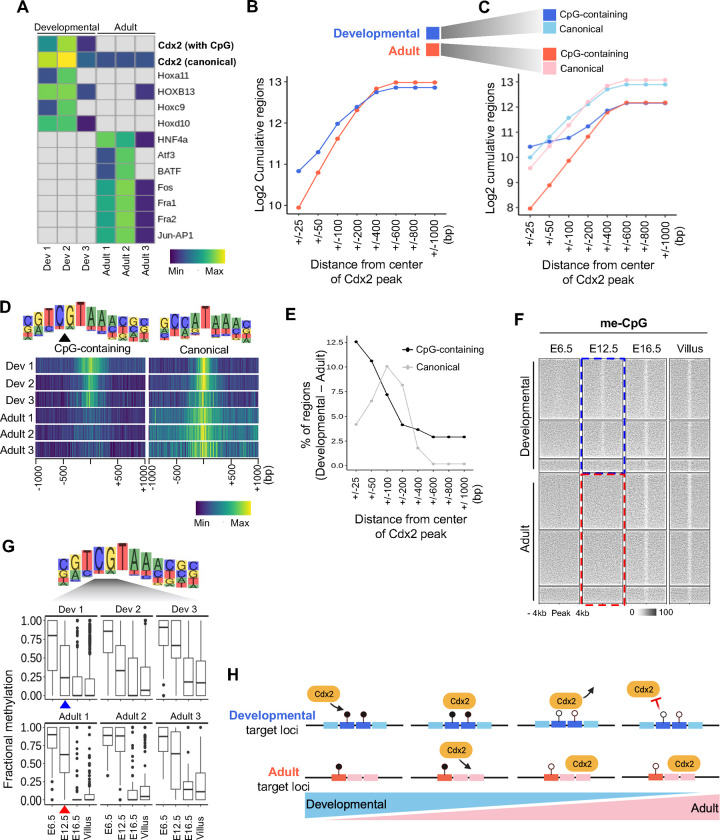
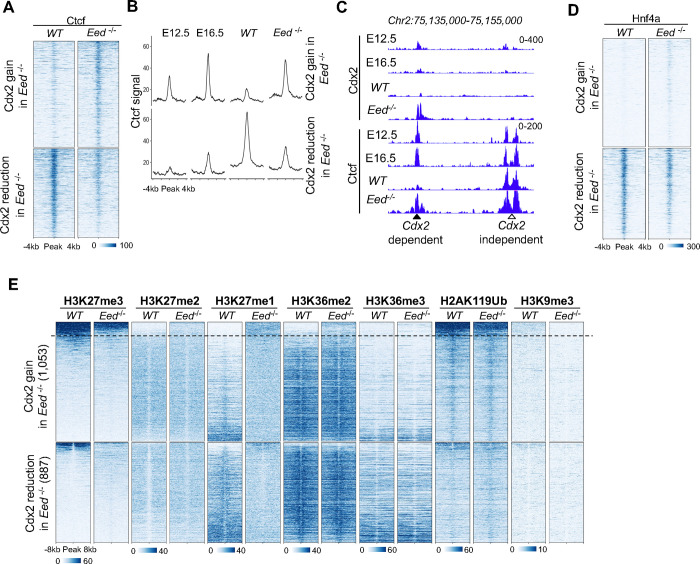
Precise spatiotemporal and cell type-specific gene expression is essential for proper tissue development and function. Transcription factors (TFs) guide this process by binding to developmental stage-specific targets and establishing an appropriate enhancer landscape. In turn, DNA and chromatin modifications direct the genomic binding of TFs. However, how TFs navigate various chromatin features and selectively bind a small portion of the millions of possible genomic target loci is still not well understood. Here we show that Cdx2 - a pioneer TF that binds distinct targets in developing versus adult intestinal epithelial cells - has a preferential affinity for a non-canonical CpG-containing motif in vivo. A higher frequency of this motif at embryonic and fetal Cdx2 target loci and the specifically methylated state of the CpG during development allows selective Cdx2 binding and activation of developmental enhancers and linked genes. Conversely, demethylation at these enhancers prohibits ectopic Cdx2 binding in adult cells, where Cdx2 binds its canonical motif without a CpG. This differential Cdx2 binding allows for corecruitment of Ctcf and Hnf4, facilitating the establishment of intestinal superenhancers during development and enhancers mediating adult homeostatic functions, respectively. Induced gain of DNA methylation in the adult mouse epithelium or cultured cells causes ectopic recruitment of Cdx2 to the developmental target loci and facilitates cobinding of the partner TFs. Together, our results demonstrate that the differential CpG motif requirements for Cdx2 binding to developmental versus adult target sites allow it to navigate different DNA methylation profiles and activate cell type-specific genes at appropriate times.


Figures

Figure 1:
Figure 1:. Evolution of Cdx2 binding across gene promoters and enhancers supports developmental and homeostatic functions in intestinal epithelium.
(A) Heatmap showing Cdx2 CUT&RUN signal at its developmental and adult specific binding sites in embryonic (E12.5), fetal (E16.5) and adult epithelial (villus) cells; Dev 1–3 and Adult 1–3 subgroups represent 2-fold change (q < 0.01) in Cdx2 signal among the three timepoints. (B) Pie charts showing percentages of Cdx2 binding sites shown in (A) (Dev 1, 2 and Adult 1, 2) within and outside promoters (TSS −2 kb to +1 kb). (C) Gain, retention, and loss of Cdx2 binding at promoters (top panel) and enhancers (bottom panel) during development from E12.5 into adult epithelial cells; numbers outside the boxes and inside the dotted boxes represent gains and losses of Cdx2 binding at each of the timepoints, respectively. (D) Genome browser tracks showing progressive loss or recruitment of Cdx2 through epithelial development at Sox4 and Fabp2 gene promoters, respectively. See also Figure S1
Figure 2.
Figure 2.. Heightened presence of CpG containing Cdx2 motif at its developmental binding sites.
(A) Heatmap showing relative prevalence of TF motifs at developmental (Dev 1–3) and adult (Adult 1–3) cell specific Cdx2 binding sites as determined by Homer. (B) Line plot showing number of Cdx2 binding loci containing Cdx2 motifs within an increasing distance (indicated on the X-axis) from the center of the Cdx2 peak. (C) Line plot showing abundance of canonical and CpG-containing Cdx2 motifs at developmental (shades of blue) and adult (shades of red) cell specific Cdx2 binding sites within an increasing distance (indicated on the X-axis) from the center of the Cdx2 peak. (D) Density plots showing relative prevalence of CpG-containing motif near the center of developmental Cdx2 peaks (Dev 1–3) in comparison with the adult cell specific Cdx2 peaks (Adult 1–3); canonical Cdx2 motif shows widespread presence near Adult 1–3 sites in contrast with the Dev 1–3 loci. (E) Higher percent of regions with development specific Cdx2 binding contain CpG-containing motif as compared to regions with adult cell specific Cdx2 binding near the center of Cdx2 peak (within +/− 50 bp); beyond 50 bp of the peak center, canonical motif is more prevalent. (F) Heatmap showing DNA methylation at Cdx2 binding loci (as in Figure 1A) in early endoderm (E6.5) (Seisenberger et al., 2012), and embryonic (E12.5), fetal (E16.5), and adult epithelial (villus) cells (Jadhav et al., 2019); Cdx2 binding in embryonic epithelium is associated with early loss of DNA methylation (blue dotted box), while sites first bound by Cdx2 in the fetal epithelium show higher methylation levels (red dotted box). (G) Fractional methylation change at CpG (4th base position) within the Cdx2 motif shows relatively early reduction in methylation at loci with developmental binding of Cdx2 (blue arrowheads) compared to binding in adult epithelium (red arrowheads). The CpG remains hypomethylated in adult villus at both developmental and adult loci. (H) A model for DNA methylation based Cdx2 binding at developmental target loci; requitement at adult target loci is driven by DNA methylation independent binding. While relative abundance of the CpG-containing motif and methylation at the CpG within the Cdx2 motif during development allows its early recruitment to these sites, demethylation at these loci protects them from ectopic Cdx2 binding in adult cells. See also Figure S2
Figure 3.
Figure 3.. Cdx2 facilitates establishment of adult homeostatic superenhancers by directing Ctcf recruitment.
(A) Percentage of developmental (blue) or adult (red) cell specific Cdx2 bound loci (as in Figure 1A) with designated number of other Cdx2 peaks nearby (+/− 50 kb); drawing in the inset represents isolated Cdx2 peaks (not within 50 kb of each other) in developing cells, while adult cells show multiple neighboring peaks in the same area; large number of (70%) of dynamic Cdx2 binding events that are solitary in developing epithelium (blue arrowhead) as opposed to only 40% in adult cells (red arrowhead). (B) Representative genomic tracks showing clustered binding of Cdx2 that grows through development near gene Krt19. (C) boxplot to the right shows number of neighboring (+/− 50 kb) dynamic Cdx2 bound enhancers (sites in Figure 1A) surrounding developmental (blue) or adult (red) cell specific Cdx2 binding loci. (D) Percentage of 1,327 developmental (E12.5 and E14.5) and 2,373 adult superenhancers that have dynamic Cdx2 binding during epithelial maturation. (E) Genome browser view of Cdx2, Ctcf, and H3K27ac signals at adult specific Cdx2 cluster at a superenhancers near Mcu13 gene; black arrowheads indicate the superenhancer borders with Cdx2 and Ctcf cobinding. Plot on the right shows gain in expression of Muc13 through development. (F) Heatmap showing Cdx2 and Ctcf signals at superenhancers in E12.5, E16.5 and adult villus. Superenhancers boundaries are shown with black arrowheads. (G) Heatmap showing Ctcf signal at developmental and adult specific Cdx2 binding sites (as in Figure 1A) in E12.5, E16.5 and adult villus cells; the regions are displayed in decreasing order of Ctcf signal. 19% and 15% loci with development specific Cdx2 binding show Ctcf occupancy at E12.5 and adult villus samples, respectively. 4% and 53% loci with adult specific Cdx2 binding show Ctcf binding in E12.5 and adult villus samples, respectively. See also Figure S3
Figure 4.
Figure 4.. Loss of PRC2 activity causes gain of DNA methylation at enhancers leading to Cdx2 recruitment.
(A) Experimental schematic showing 5 intraperitoneal injections of Tamoxifen (TAM) on consecutive days cause deletion of Eed across the intestinal epithelium; epithelial cells are collected 4 days after the last injection (experimental day 9). (B) Genome browser view showing gain of CpG methylation in Eed−/− epithelium at multiple enhancer loci near Lasp1 gene that are identified as DMRs; promoter region remains unmethylated. Pie chart showing percentages of DNA methylation gains at promoters and enhancers. (C) Density plot showing DNA methylation at promoter (top panel) and non-promoter (bottom panel) linked UMRs and LMRs; LMRs (mostly representing enhancers) have the most prevalent gain of methylation in Eed−/− cells. (D) Heatmap showing genomic states identified by CHROMHMM based on TF binding and histone modifications corresponding to promoter, enhancer, and repressed chromatin; Cdx2 occupied enhancers (H3K4me1+ and H3K27ac+) particularly show gain in DNA methylation in Eed−/− cells, while promoters (H3K4me3+) and repressed chromatin regions (H3K27me3+ or H3K9me3+) show relatively stable unmethylated and methylated status, respectively. (E) DNA methylation profiles at development and adult specific Cdx2 binding sites (Dev 1–3 and Adult 1–3, respectively) showing the gain of methylation upon loss of PRC2 activity (Eed−/−). (F) Profile plot of Cdx2 signal show ectopic recruitment of Cdx2 at developmental loci (Dev 1) in adult Eed−/− cells in concordance with the gain of DNA methylation in (E). (G) Genomic tracks showing Abcc4 gene locus with CpG-containing Cdx2 motif bound by the TF only during development, where gain of methylation at the Cdx2 binding locus in Eed−/− leads to recruitment of the TF; dot plot at the bottom shows methylated (solid black dots) or unmethylated (white dots) status of the CpG in Cdx2 motif (4th position) in 8 independent sequencing reads from WT and Eed−/− WGBS data. See also Figure S4
Figure 5.
Figure 5.. Altered Cdx2 binding in adult cells revives developmental Ctcf recruitment.
(A) Heatmap showing significant (q < 0.05, 1.5X) gain or reduction of Cdx2 binding in Eed−/− cells as compared to the native villus cells (WT). (B) Profile plots showing Cdx2 signal at loci with gain and loss of Cdx2 binding in Eed−/− cells from embryonic (E12.5), fetal (E16.5), adult villus, and Eed−/− epithelium. (C) Profile plots showing DNA methylation signal at loci with gain or reduction of Cdx2 binding in Eed−/− cells from embryonic (E6.5 and E12.5), fetal (E16.5), adult villus, and Eed−/− epithelium. (D) Fractional methylation change at CpG at the 4th position within Cdx2 motif shows gain of methylation in Eed−/− cells at the sites with altered Cdx2 binding. (E) Heatmap showing chromatin accessibility dynamics at sites with gain or reduction of Cdx2 binding in Eed−/− cells as compared to WT cells (as in a); chromatin accessibility from developmental timepoints at the Cdx2 bound loci is lost with lack of Cdx2 binding in adult cells (as seen in a) and rebinding of Cdx2 to such loci in Eed−/− cells reinduces open chromatin formation. (F) Genomic tracks showing recruitment of Cdx2 to developmental site in Eed−/− accompanied by gain of chromatin accessibility and increase in DNA methylation at the Cdx2 binding locus; dot plot at the bottom shows methylated (solid black dots) or unmethylated (white dots) status of the CpG in Cdx2 motif (4th position) in 6 independent sequencing reads from WT and Eed−/− WGBS data. (G) Heatmap showing alterations in active enhancer mark H3K27ac at the sites with Cdx2 gain or reduction in Eed−/− cells as compared to WT cells (as in a); enhancer activity from developmental timepoints at the Cdx2 bound loci is lost with lack of Cdx2 binding in adult cells (as seen in a) and rebinding of Cdx2 to such loci in Eed−/− cells reactivates these enhancers. (H) A model showing DNA methylation based Cdx2 binding at developmental target loci; Cdx2 is recruited to developmental sites upon gain of methylation of CpG (at 4th position) within the Cdx2 motif in adult Eed−/− cells. See also Figure S5
Figure 6.
Figure 6.. Perturbed Cdx2 binding resulting from DNA methylation changes leads to altered cobinding of TFs.
(A) Heatmap showing Ctcf signal in adult villus and Eed−/− epithelium at loci with gain or reduction of Cdx2 binding (as in Figure 5A). (B) Profile plots showing Ctcf signal from embryonic (E12.5), fetal (E16.5), adult villus, and Eed−/− epithelium at the loci with gain or reduction of Cdx2 binding in Eed−/− cells. (C) Genomic tracks showing corecruitment of Ctcf with Cdx2 in adult Eed−/− cells reviving the early embryonic binding at E12.5; a nearby locus shows stable binding of Ctcf independent of Cdx2 occupancy. (D) Heatmap showing Hnf4a signal in adult villus and Eed−/− epithelium at loci with gain or reduction of Cdx2 binding (as in Figure 5A). (E) Heatmaps showing signal of various histone modifications in adult epithelial cells at sites with Cdx2 gain or reduction in Eed−/− cells (as in Figure 5A); regions in each cluster are arranged in decreasing order of the repressive H3K27me3 modification signal. The loci above the dotted line are positive for H3K27me3 and show no H3K36me2 signal in WT epithelium. See also Figure S6
Figure 7.
Figure 7.. Direct inhibition of DNA methylation causes loss of Cdx2 binding and remethylation at binding loci allows its recruitment.
(A) Experimental schematic showing treatment of HCT116 cells with DNA methylation inhibitor GSK-3484862 or DMSO (control) for 6 days in order to eliminate CpG methylation followed by 3 days of recovery without the drug (or DMSO) to allow for remethylation. (B) Fluorescence micrographs showing loss of DNA methylation upon treatment with inhibitor GSK-3484862 for 6 days. (C) Heatmap showing loss of Cdx2 binding at loci with CpG-containing Cdx2 motif in HCT116 cells treated with DNA methylation inhibitor as compared to DMSO (control); upon removal of the inhibitor, Cdx2 is recruited back to these loci within 3 days. (D) Representative genomic tracks showing loss of Cdx2 binding upon elimination of DNA methylation in HCT116 cells through treatment with GSK-3484862 as opposed to the stable binding upon treatment with DMSO (control); removing the inhibitor from the cell culture media causes recovery of the Cdx2 binding. (E) Box and whisker plot showing significant loss of Cdx2 binding at 471 loci with CpG-containing Cdx2 binding motif upon treatment with DNA methylation inhibitor and recovery of this binding signal upon removal of the inhibitor; there is no significant change in Cdx2 binding at 500 randomly chosen loci without the CpG-containing motif (F).

Similar articles

References

    1. Adams C.C., and Workman J.L. (1995). Binding of disparate transcriptional activators to nucleosomal DNA is inherently cooperative. Mol Cell Biol 15, 1405–1421. - PMC - PubMed
    1. Anders S., Pyl P.T., and Huber W. (2015). HTSeq--a Python framework to work with high-throughput sequencing data. Bioinformatics 31, 166–169. - PMC - PubMed
    1. Azevedo Portilho N., Saini D., Hossain I., Sirois J., Moraes C., and Pastor W.A. (2021). The DNMT1 inhibitor GSK-3484862 mediates global demethylation in murine embryonic stem cells. Epigenetics Chromatin 14, 56. - PMC - PubMed
    1. Bailey T.L., Johnson J., Grant C.E., and Noble W.S. (2015). The MEME Suite. Nucleic Acids Res 43, W39–49. - PMC - PubMed
    1. Bird A., Taggart M., Frommer M., Miller O.J., and Macleod D. (1985). A fraction of the mouse genome that is derived from islands of nonmethylated, CpG-rich DNA. Cell 40, 91–99. - PubMed

Publication types