[Preprint]. 2024 Feb 9:rs.3.rs-3922904.
doi: 10.21203/rs.3.rs-3922904/v1.

In vivo affinity maturation of the HIV-1 Env-binding domain of CD4

Affiliations

In vivo affinity maturation of the HIV-1 Env-binding domain of CD4

Andi Pan et al. Res Sq. .

Update in

  • In vivo affinity maturation of the CD4 domains of an HIV-1-entry inhibitor.
    Pan A, Bailey CC, Ou T, Xu J, Aristotelous T, Liu X, Hu B, Crynen G, Skamangas N, Bronkema N, Tran MH, Mou H, Zhang X, Alpert MD, Yin Y, Farzan M, He W. Pan A, et al. Nat Biomed Eng. 2024 Dec;8(12):1715-1729. doi: 10.1038/s41551-024-01289-1. Epub 2024 Dec 5. Nat Biomed Eng. 2024. PMID: 39638875 Free PMC article.

Abstract

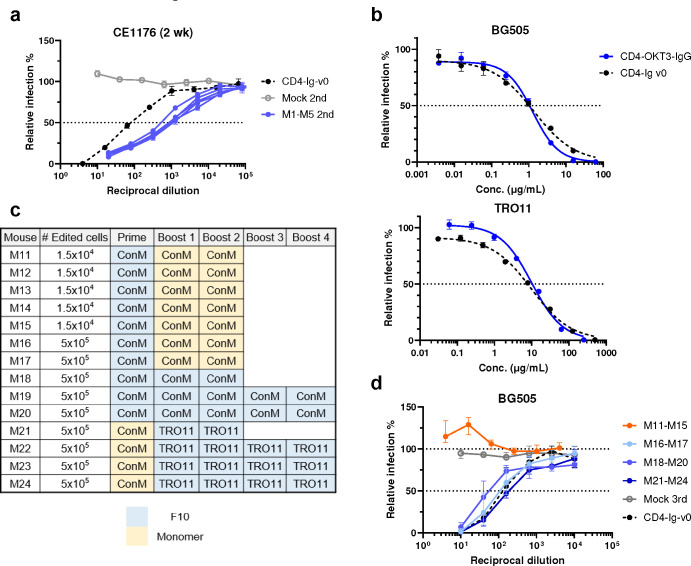
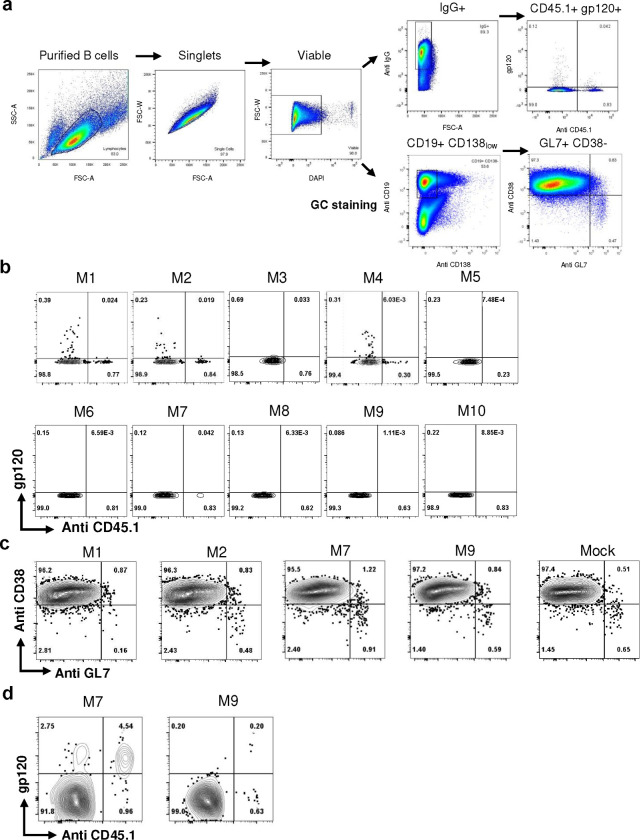
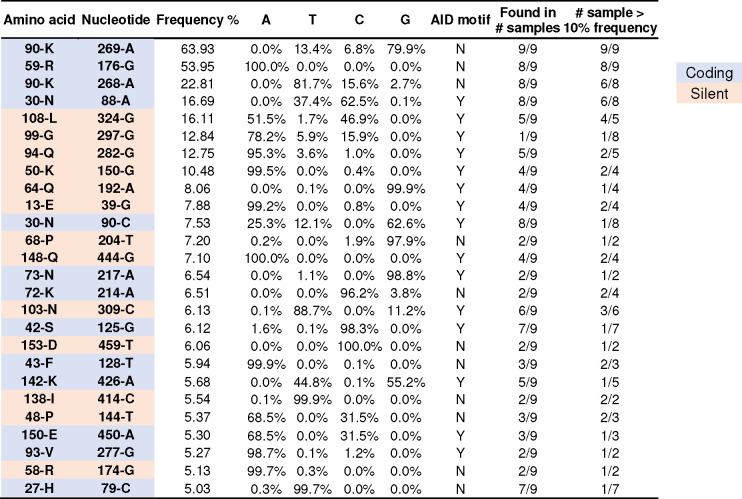
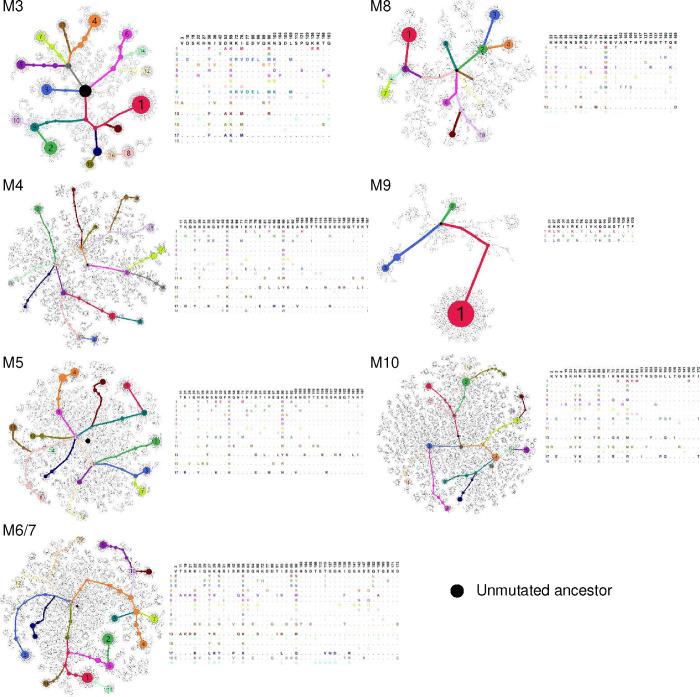
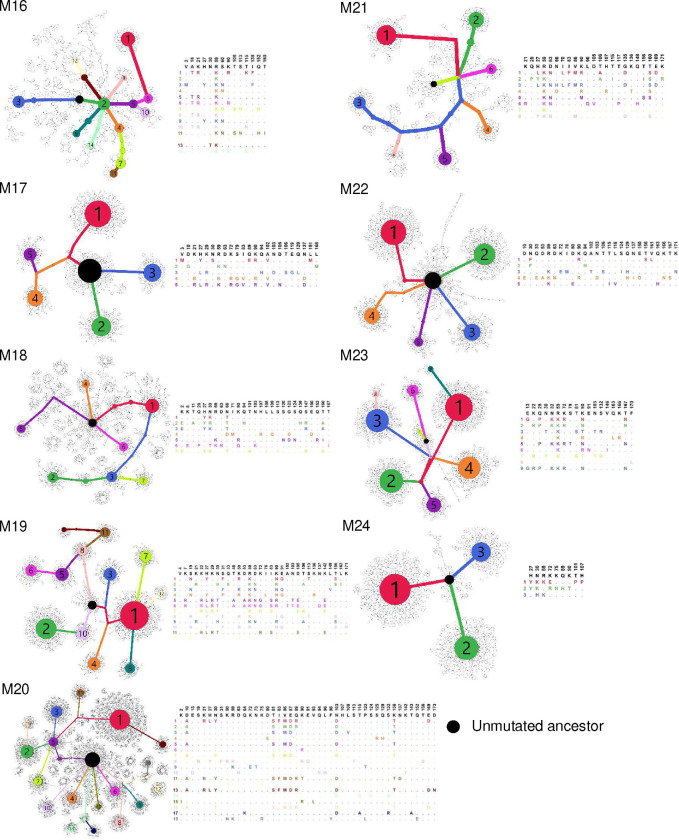
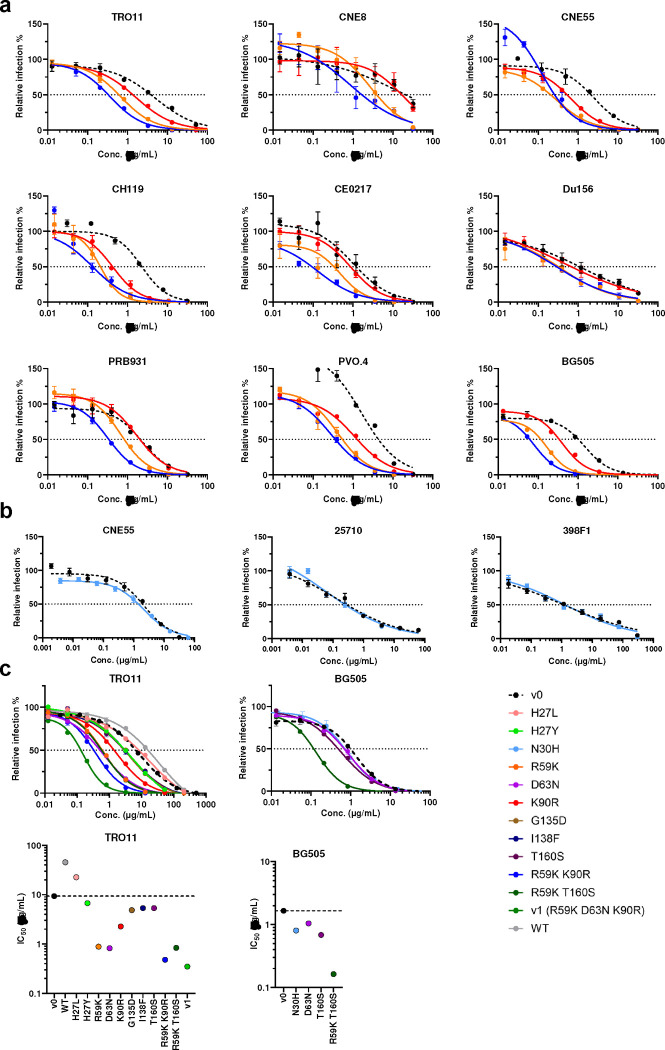
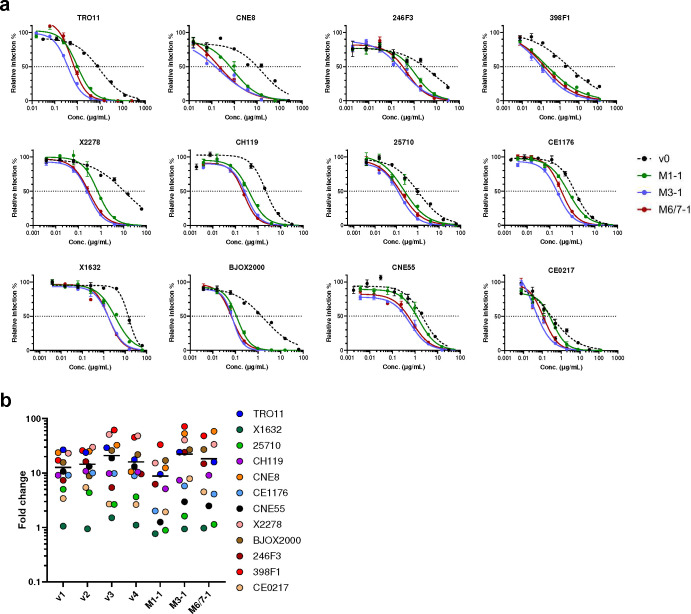
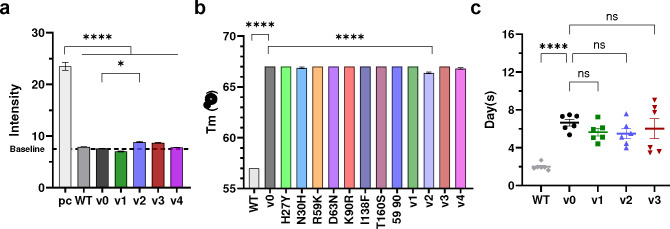
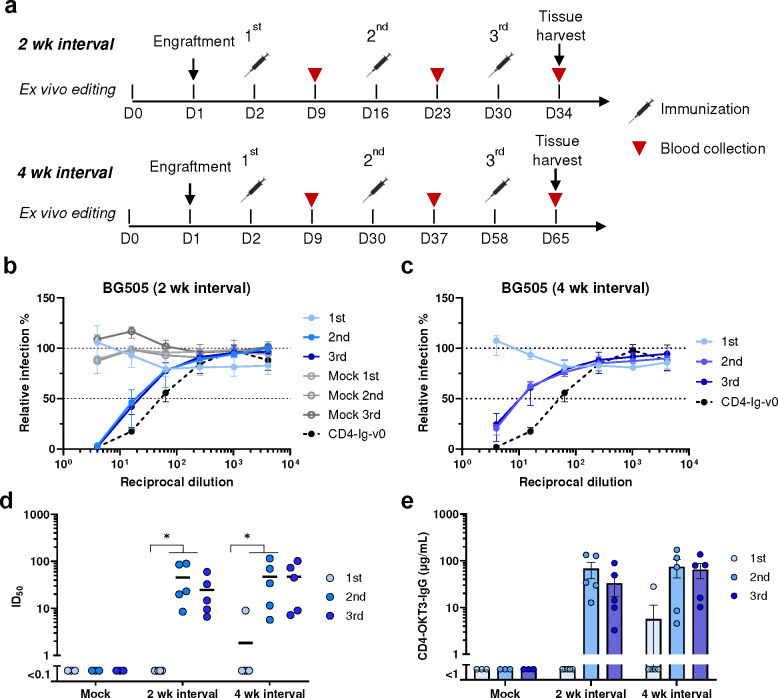
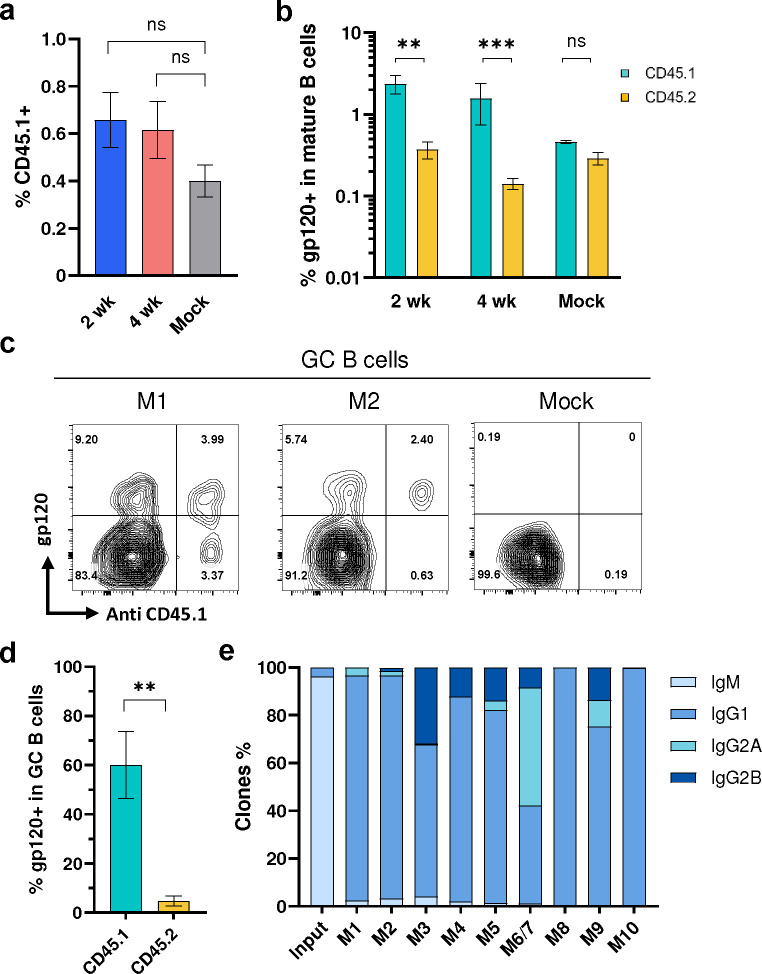
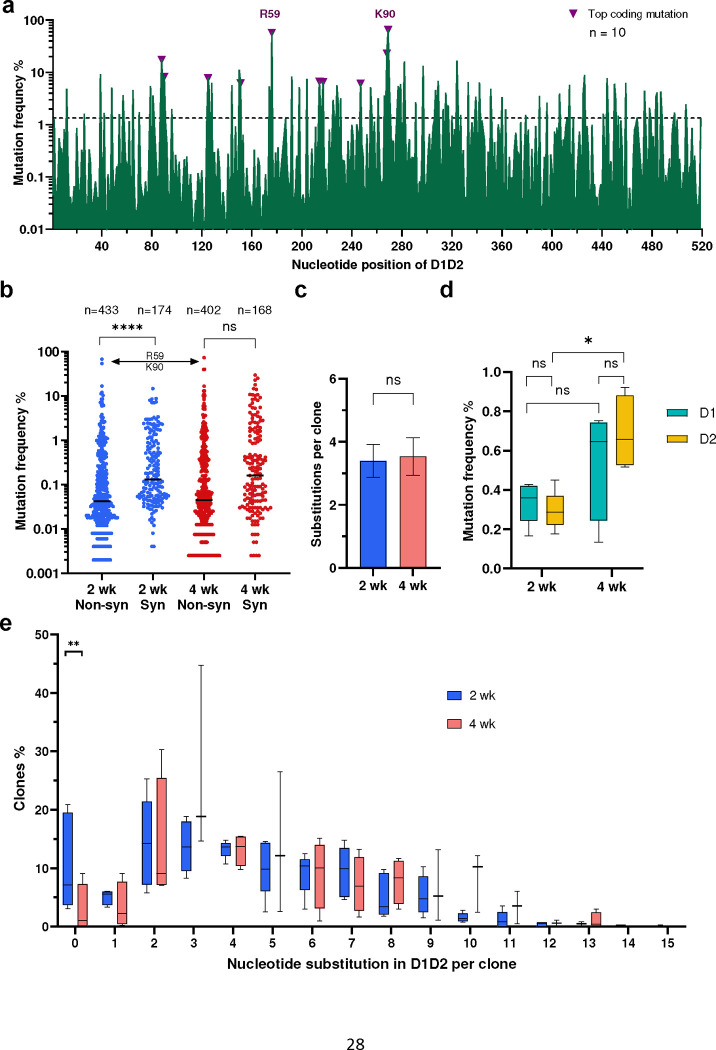
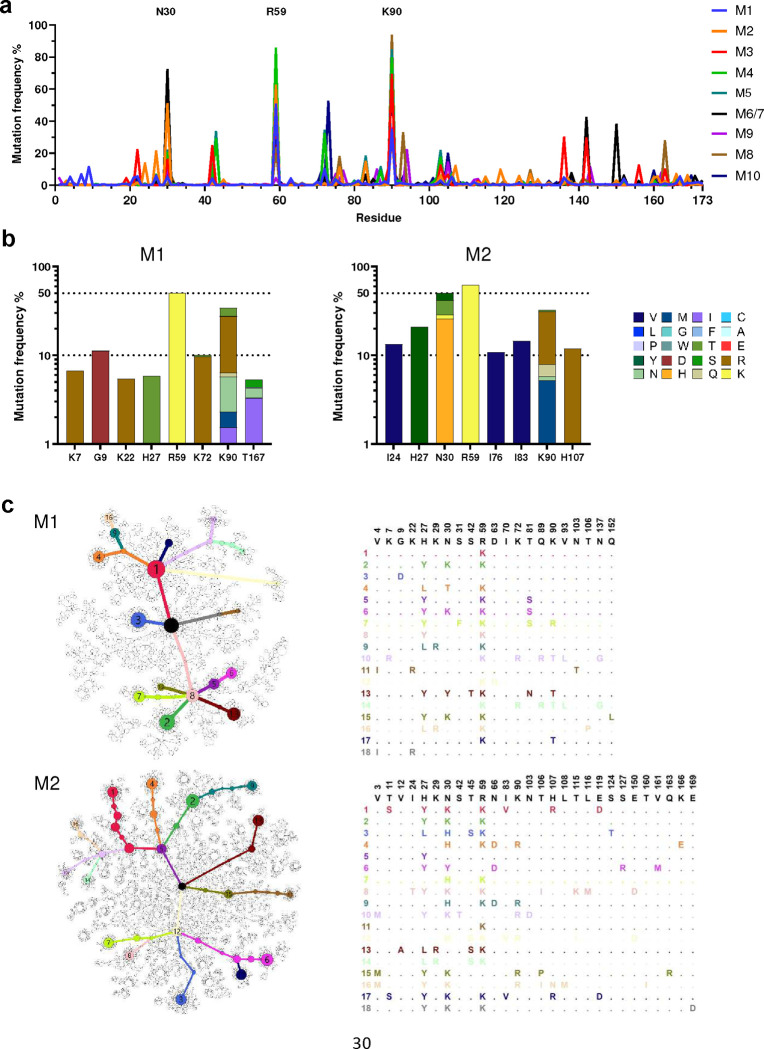
Many human proteins have been repurposed as biologics for clinical use. These proteins have been engineered with in vitro techniques that improve affinity for their ligands. However, these approaches do not select against properties that impair efficacy such as protease sensitivity or self-reactivity. Here we engineer the B-cell receptor of primary murine B cells to express a human protein biologic without disrupting their ability to affinity mature. Specifically, CD4 domains 1 and 2 (D1D2) of a half-life enhanced-HIV-1 entry inhibitor CD4-Ig (CD4-Ig-v0) were introduced into the heavy-chain loci of murine B cells, which were then adoptively transferred to wild-type mice. After immunization, transferred B cells proliferated, class switched, affinity matured, and efficiently produced D1D2-presenting antibodies. Somatic hypermutations found in the D1D2-encoding region of engrafted B cells improved binding affinity of CD4-Ig-v0 for the HIV-1 envelope glycoprotein (Env) and the neutralization potency of CD4-Ig-v0 by more than ten-fold across a global panel of HIV-1 isolates, without impairing its pharmacokinetic properties. Thus, affinity maturation of non-antibody protein biologics in vivo can guide development of more effective therapeutics.


Conflict of interest statement

COMPETING INTEREST A.P., W.H., T.O., Y.Y. and M.F. are inventors of a pending patent describing the in vivo affinity maturation of antibodies and biologics. C.C.B., M.D.A., and M.F. have equity stakes in Emmune, Inc., which developed CD4-Ig-v0. The authors have no other competing interests.

Figures

Extended Data Fig. 1
Extended Data Fig. 1. Comparison of three D1D2 display strategies in primary murine B cells.
a Structure of edited BCRs showing three designs of CD4 D1D2 presenting B-cell receptors. Below each structure is a representation of its corresponding cassette. D1D2 (yellow)=) was attached to the N terminus of OKT3 heavy chain variable region (CD4-OKT-VH, green, left) or the OKT3 kappa light chain constant region (light blue, center and right). OKT3 kappa light chain constant region was linked to heavy chain constant region via a GS linker (CD4-Cĸ-GS, center), or non-covalently associated with heavy chain constant region by P2A cleavage (CD4-Cĸ-P2A, right). b The editing strategy used to express constructs in a in primary murine B cells. In this case, homology arms of the repair template complement an intronic region immediately downstream of JH4, –, and a cassette including a poly-A tail that terminates transcription of the VDJ region, a splice acceptor (SA), a heavy-chain promoter, a D1D2 construct shown in a, and a splice donor (SD). This ‘intron-editing’ strategy enables efficient introduction of these cassettes, but interferes with efficient somatic hypermutation, preventing affinity maturation of the expressed B-cell receptor. An alternate strategy, used hereafter, is represented in Fig. 1b. c Flow cytometric analysis of singlet viable B cells edited using the strategy in b were stained with anti-IgM antibodies and either anti-human CD4 antibodies or gp120 at 48 h post-editing. HDRTs were delivered by 105 MOI rAAV-DJ with homology arms targeting J4 and the intron immediate downstream J4. a, b are created with BioRender.com.
Extended Data Fig. 2
Extended Data Fig. 2. Neutralization of mouse serum and CD4-OKT-IgG to various pseudoviruses and immunization regimen of mice receiving protein immunogens.
a Neutralizing response against HIV-1 CE1176 pseudovirus. Sera collected from mice (n = 5) engrafted with edited cells and immunized twice by mRNA-LNP at two-week interval were tested in TZM-bl assays and represented as individual curves. Sera from mice (n = 3) engrafted with unedited CD45.1 B cells and immunized on two-week interval (grey dots) served as negative controls. Dots and error bars of negative controls indicate median and interquartile range. Positive control CD4-Ig-v0 was mixed with normal mouse serum at 125 μg/ml. Error bars represent SEM. b. Neutralizing potency of CD4-OKT3-Ig. CD4-OKT3-Ig purified by size exclusion chromatography (SEC) was compared with CD4-Ig-v0 for IC50 for BG505 and TRO11 pseudoviruses (PVs). c Engraftment and immunization regimen for additional mice edited with the same method as Fig. 1 but vaccinated with protein antigens. Mice were engrafted with 15,000 (M11 through M15) or 500,000 (M16 through M24) successfully edited B cells, as determined by flow cytometry analysis. Mice were vaccinated with protein antigens (monomeric or decametric ConM gp120, and monomeric TRO11 gp120) at two-week interval. Schedule of blood and tissue collection is the same as in Fig. 2a. Decameric antigens are indicated in blue, and monomeric antigens in yellow. d Sera neutralizing response of mice in c against BG505 PV. Dots and error bars indicate median and interquartile range. Sera from mice (n = 3) engrafted with unedited CD45.1 B cells and immunized with decametric ConM gp120 (grey dots) serve as negative controls. Note that protein immunization induced neutralizing response only in groups engrafting with a higher number of cells.
Extended Data Fig. 3.
Extended Data Fig. 3.. Analysis of antigen binding B cells after three immunizations.
a Gating strategy for flow cytometry analysis of donor and recipient antigen binding B cells and germinal center B cells in recipient mice. For Fig. 3a–b, mature B cells were gated as singlet viable IgG+ cells. For Fig. 3c–d, GC B cells were gated as singlet viable CD19+ CD138low cells. b Flow cytometry analysis of antigen binding B cells in singlet viable IgG+ donor (CD45.1) and recipient (CD45.2) population for Fig. 3a–b. c Flow cytometry analysis of germinal center (GL7+ CD38−) B cells from spleen and lymph nodes harvested four days after three immunizations. M1 and M2 were from 2 wk group; M7 and M9 were from 4 wk group. d Flow cytometry analysis of antigen binding GC B cells in M7 and M9, as quantified in Fig. 3d. M1 and M2 were shown in Fig. 3c.
Extended Data Fig. 4
Extended Data Fig. 4. Analysis of AID motif and convergence of the top nucleotide mutations among 10 mRNA-immunized mice.
The first two columns show the original amino acid and nucleotide. AID hotspot motifs are defined as DGYW / WRCH (R=A/G, Y=C/T, and W=A/T). Mutation frequency is calculated as an average from 10 mice immunized by mRNA-LNP every two or four weeks. Blue bars indicate percentage of mutation. Y/N indicates whether the mutation is located at AID motifs. Coding mutations are labeled in light blue; silent mutations are labeled in light orange.
Extended Data Fig. 5.
Extended Data Fig. 5.. Diverse and convergent amino-acid mutations in engrafted mice.
a Eight residues with the highest mutation rate across D1D2 from mice (M3 through M10) that were not presented in Fig. 5b, immunized with mRNA-LNP at two-week and four-week intervals. b Eight residues with the highest mutation rate from the rest of mice (M16 through M24) immunized with adjuvanted proteins at two-week and four-week intervals, as shown in Extended Data Figure 2c. Note that mice M11-M15 were engrafted with low numbers of successfully edited B cells (15,000) like M3-M10; M16-M24, engrafted with 500,000 edited B cells, were immunized with protein antigens. No gp120-binding donor cells were isolated from mice M11-M15, and they were therefore excluded from NGS analysis.
Extended Data Fig. 6.
Extended Data Fig. 6.. Minimum spanning trees and mutations for mice immunized with mRNA-LNP or adjuvanted protein.
Minimum spanning trees of D1D2 sequences, similar to those presented in Fig. 5c, for additional mice immunized by mRNA-LNP every two or four weeks (M3 through M10), or by adjuvanted protein every two weeks (M16 through M24). M6 and M7 were combined into one sample. Each tree presents the inferred lineage and all amino-acid mutations found in each mouse. The central black dot represents the inferred ancestral sequence which corresponds to the input sequence. Each circle indicates a distinct amino-acid sequence. Circle size is proportional to the number distinct nucleotide sequences with the same translation. Colored circles mark the translations encoded by the largest number of distinct sequences, with the rank order indicated by number. Branch length corresponds to evolutionary distance, defined as the number of amino-acid differences.
Extended Data Fig. 7.
Extended Data Fig. 7.. Neutralization of CD4-Ig variants with single or double mutations against a panel of HIV-1 isolates.
a Neutralization curves of CD4-Ig variants modified with R59K (orange), K90R (red), or combined (blue) against several HIV-1 PV. IC50 values are presented in Fig. 6a. b Neutralization curves of CD4-Ig N30H, a recurring mutation from NGS analysis, against three HIV-1 PVs. c Neutralization curves of CD4-Ig variants against BG505 and TRO11 in an initial screening for potent CD4-Ig variants. All curves were fitted with a variable slope four parameters dose response model.
Extended Data Fig. 8.
Extended Data Fig. 8.. Naturally occurring D1D2 variants improved the neutralization potency of CD4-Ig-v0.
a Representative neutralization curves of CD4-Ig-v0 and three naturally emerging variants against a 12-isolate global panel of HIV-1 pseudoviruses. These variants represented the nodes with the largest number of progenies identified in M1, M3, and M6/7 in Extended Data Fig. 6. Curves were fitted with a variable slope four parameters dose response model. b Fold change of neutralization potency of isolates shown in Fig. 6d relative to CD4-Ig-v0. The center line indicates the geometric mean.
Extended Data Fig. 9.
Extended Data Fig. 9.. Affinity matured CD4-Ig variants retained bioavailability.
a The polyreactivity of CD4-Ig variants were measured by immunofluorescence assays using HEp-2 cells and 200 μg/ml of each antibody. The autoreactive antibody 2F5 served as a positive control (pc). Baseline (dashed line) was determined as the fluorescence intensity of negative human serum. Each bar is an average of four independent measurements. Error bars indicate SEM. All CD4-Ig variants were significantly less polyreactive than 2F5, as determined by two-way ANOVA with Dunnett’s multiple comparison (*p < 0.05; ****p < 0.0001). b Thermostability of CD4-Ig variants. Measured by differential scanning fluorimetry, each bar represents an average of two independent experiments. Significance was determined by two-way ANOVA with Dunnett’s multiple comparison (****p < 0.0001). c Pharmacokinetic studies of CD4-Ig variants in immunocompromised hFcRn mice. 8 mg/kg of the indicated CD4-Ig variants was infused intravenously into six nine-week old mice per group. Sera were collected at days 1, 3, 6, 14, 21 and 31. CD4-Ig concentration was measured by ELISA with anti-CD4 antibodies. Half-life was calculated by fitting a one-phase model. Each dot represents the half-life of a CD4-Ig variant in one mouse. Significance was determined two-way ANOVA with Šídák’s multiple comparisons (*p < 0.05; ****p < 0.0001).
Fig. 1:
Fig. 1:. Engineering primary murine B cells to express a B-cell receptor with CD4 domains 1 and 2.
a A representation of an engineered BCR with a potency and half-life enhanced form of CD4 domains 1 and 2 (D1D2) fused through a (G4S)3 linker to the amino-terminus of the heavy-chain variable region of the mouse antibody OKT3 (D1D2-OKT3-VH). The OKT3 heavy chain pairs with an endogenous mouse light chain. b Introducing D1D2-OKT3-VH at the murine heavy-chain locus. The CRISPR effector protein Mb2Cas12a targets the J4 coding region 5’ of a CTTA PAM, as represented. An rAAV-delivered homology directed repair template (HDRT) complements the 5’ UTR of a VH segment and the intron 3’ of JH4 using 576 bp and 600 bp homology arms, respectively. The edited genome replaces the VDJ-recombined heavy chain with a cassette encoding D1D2-OKT3-VH. c Expression of D1D2-OKT3-VH in primary mouse B cells. Expression of D1D2 in edited cells was measured by flow cytometry with monomeric HIV-1 gp120. Representative flow cytometry plots of B cells edited with HDRT targeting the 5’ UTR of VH1–34 or V1–64 were generated 48 h after electroporation. HDRT were delivered with rAAV transduced at 104 multiplicity of infection (MOI). Controls include cells electroporated with Mb2Cas12a ribonucleoproteins (RNP) without rAAV (No HDRT) or without gRNA but transduced with HDRT-encoding rAAV (No gRNA). Plots were gated on viable singlet B cells. d Quantitation of editing efficiency in c from independent experiments. Each dot represents an average from two biologically independent replicates. Error bars represent standard error of mean (SEM). Statistical significance was determined by two-way ANOVA followed by H-Šídák’s multiple comparisons (****p < 0.0001). a, b are created with BioRender.com.
Fig. 2:
Fig. 2:. Engineered B cells generated neutralizing responses in immunized mice.
a Schedule of immunization and blood collections from mice analyzed in subsequent figures. Naïve B cells from CD45.1 donor mice were engineered ex vivo and 5 million cells per mouse were adoptively transferred to CD45.2 recipient mice 24 h later. Mice were immunized with SOSIP-TM (16055-ConM-8.1) mRNA-LNP on two-week (2 wk, Day 2, 16, and 30, n = 5) or four-week (4 wk, Day 2, 30, 58, n = 5) intervals, and serum was collected seven days after each immunization. Spleens and lymph nodes were harvested four days after the final immunization and B cells isolated from these tissues were analyzed by flow cytometry and next-generation sequencing (NGS). b, c Neutralizing responses of sera from mice immunized with SOSIP-TM mRNA. Sera from mice immunized at two-week (b) or four-week (c) intervals were measured individually for their ability to neutralize BG505 HIV-1 pseudovirus in TZM-bl cell assays. Sera from mice (n = 3) engrafted with unedited CD45.1 B cells and immunized on two-week interval (grey dots) served as negative controls. 100 μg/ml CD4-Ig-v0 combined with normal mouse serum served as a positive control. Dots and error bars indicate median and interquartile range for each group. d A summary of the 50% inhibitory dilutions (ID50) of sera from each immunized mouse in b and c. Statistical significance was determined using repeated-measures two-way ANOVA with Geisser-Greenhouse correction. e Serum concentration of CD4-OKT3-IgG after each immunization, measured by ELISA with an anti-CD4 antibody and CD4-OKT3-IgG as the standard.
Fig. 3:
Fig. 3:. Engineered B cells persisted in vivo following immunization.
a Quantification of CD45.1-positive donor B cells in vaccinated mice. Four days after the final vaccination of mice characterized in Fig. 2, B cells were isolated from their lymph nodes and spleens. B cells were analyzed by flow cytometry. Figure shows the percent of CD45.1-positive donor cells in mice immunized at two-week (2 wk, n = 4) or four-week intervals (4 wk, n = 5). Mice similarly engrafted with unedited cells and immunized in parallel (Mock, n = 3) served as the controls. For gating strategies, see Extended Data Fig. 3a. b A greater proportion of CD45.1 donor cells binding to HIV-1 gp120. The cells analyzed in panel a were measured for binding to HIV-1 gp120. See Extended Data Fig. 3b for source flow cytometry analysis. c Enrichment of gp120-binding donor cells in the germinal center. Germinal center (GC) B cells (CD38− GL7+) were analyzed by flow cytometry for their ability to bind gp120 and an anti-CD45.1 antibody. Two representative examples (M1 and M2) from mice immunized at two-week interval are shown. Additional examples are provided in Extended Data Fig. 3d. d Quantification of results from experiments shown in c (n = 4). e Distribution of isotypes among D1D2-expressing donor B cells isolated after the final immunization compared with edited donor B cells before engraftment, as determined by NGS. M6 and M7 was combined as one sample. For a, b, d, error bars indicate SEM. Statistical significance was determined by generalized linear mixed model followed by Tukey HSD pairwise comparisons (*p < 0.05; **p < 0.01; ***p < 0.001).
Fig. 4:
Fig. 4:. D1D2-expressing B cells hypermutated and class switched in vivo.
a Nucleotide mutation frequency across the D1D2-encoding region. mRNA isolated from CD45+ IgG+ gp120-binding B cells from each of 10 mice was analyzed by NGS and the mean frequency of nucleotide mutations is plotted for each position. Triangles represent the most frequent coding mutations. Codons for R59 and K90 are indicated. b Distribution of synonymous (Syn) and non-synonymous (Non-syn) mutation frequency across D1D2. Each dot represents the mutation frequency at one nucleotide position, averaged on five mice in each group. The top two dots indicate the nucleotide mutations leading to R59 and K90 mutations. Line indicates the median. c Average number of accumulated mutations per unique sequence. Significance was determined by two-tailed unpair t test. d The frequency of synonymous mutations within domains 1 (D1) and 2 (D2) for mice immunized at two-week (2 wk) and four-week (4 wk) intervals. The center line indicates mean, and boxes denote quartile range. Repeated measure mixed effects analysis with H-Šídák’s multiple comparisons (*p < 0.05). e Distribution of accumulated nucleotide mutations per unique D1D2 sequence. The center line indicates mean, and boxes denote quartile range. Statistical significance in b, e was determined by mixed effects analysis with H-Šídák’s multiple comparisons (*p < 0.05; **p < 0.01; ***p < 0.001; ****p < 0.0001).
Fig. 5:
Fig. 5:. Diverse and convergent amino-acid mutations in engrafted mice.
a The frequency of amino acid changes across D1D2 sequences from each mouse (M1 through M10). Three amino acids with the highest mutation rate are labeled. M6 and M7 were combined in sequencing analysis. b Amino acid changes found in the eight most frequently mutated D1D2 residues from the indicated mice immunized at two-week intervals (M1, M2) are represented. The data for remaining mice are shown in Extended Data Fig. 5. c Minimum spanning trees of D1D2 sequences from individual mice. Each tree presents the inferred lineage and all amino-acid mutations found in M1 and M2. The central black dot represents the inferred ancestral sequence which corresponds to the input sequence. Each circle indicates a distinct amino-acid sequence. Circle size is proportional to the number distinct nucleotide sequences with the same translation. Colored circles mark translations encoded by the eighteen largest number of distinct sequences, with the rank order indicated by number. Branch length corresponds to evolutionary distance, defined as the number of amino-acid differences. The figures for the remaining mice are provided in Extended Data Fig. 6.
Fig. 6.
Fig. 6.. In vivo hypermutations in D1D2 improve the neutralization potency of CD4-Ig-v0.
a Neutralization potency of CD4-Ig-v0 and its variants modified with R59K, K90R, or combined against the indicated isolates in TZM-bl assays. Curves are shown in Extended Data Figure 7a. Statistical significance was determined by two-way ANOVA with Dunnett’s multiple comparisons. b Location of selected D1D2 mutations (lime) shown on a structure of CD4 (yellow) bound to an HIV-1 Env trimer (light grey). Structure was adapted from pdb:5U1F. c Representative neutralization curves of CD4-Ig, CD4-Ig-v0 and v1-v4 variants bearing combinations of mutations listed below the figure, against a 12-isolate global panel of HIV-1 pseudoviruses. All curves were fitted with a variable slope four parameters dose response model. d IC50 of CD4-Ig, CD4-Ig-v0 and the indicated engineered (v1-v4) and naturally emerging variants (M1–1, M3–1, M6/7–1) against the global panel (****p < 0.0001). Each dot represents an average of two independent experiments. Center lines indicate median. Statistical significance in d was determined by repeated-measures two-way ANOVA with Dunnett’s multiple comparisons.
Fig. 7.
Fig. 7.. CD4-Ig variants bind Env trimers with higher affinity than CD4-Ig-v0.
a Fitted sensorgrams show one of two replicates of the indicated CD4-Ig variant binding to 16055-ConM-v8.1 SOSIP trimers. Anti-human IgG antibodies were immobilized on the surface to capture CD4-Ig. After CD4-Ig capture, SOSIP protein was injected at concentrations of 800, 400, 200, 100, 50 nM in single-cycle kinetics at 25°C. The experimental data were fitted with a 1:1 Langmuir model. b Summary of Koff, Kon and Kd for CD4-Ig variants. Kd is calculated from Koff and Kon.

References

    1. Ebrahimi S.B. & Samanta D. Engineering protein-based therapeutics through structural and chemical design. Nature Communications 14 (2023). - PMC - PubMed
    1. Beerli R.R. et al. Isolation of human monoclonal antibodies by mammalian cell display. Proceedings of the National Academy of Sciences 105, 14336–14341 (2008). - PMC - PubMed
    1. Boder ET W.K. <yeast display nat biotech 1997.pdf>. Nat Biotechnol 15, 553–557 (1997). - PubMed
    1. GP S. Filamentous fusion phage: novel expression vectors that display cloned antigens on the virion surface. Science 228, 1315–1317 (1985). - PubMed
    1. Ren X., Zhao M., Lash B., Martino M.M. & Julier Z. Growth Factor Engineering Strategies for Regenerative Medicine Applications. Front Bioeng Biotechnol 7, 469 (2019). - PMC - PubMed

Publication types